Quantcast
Channel: Government Debt – silveristhenew
Viewing all 150 articles
Browse latest View live

We Are Already In Depression (If Borrowing Money Is Not Income)

$
0
0

Via Baker & Company Advisory Group,

  • The U.S. economy is not as solid as it appears.
  • Statistical anomalies hide profound weakness.
  • I will examine actual GDP and actual employment.
  • Warning: not for the faint of heart.

Do you consider debt as income? Before you answer that, let’s perform a thought experiment. Imagine that you had taken a long cruise last fall and charged $10,000 to an American Express card. When you did your taxes this year, would have told the IRS that you had $10,000 income from American Express? Of course you wouldn’t. Suppose a major oil company issues $800 million worth of bonds to develop a new old field. Would the company report that as income to the stockholders or the IRS? Of course they wouldn’t. I am sure those sound like silly questions as the answer is a self evident “NO!” We do not consider borrowed money as income. It is a liability that must be paid back. Then why do we count Federal Government debt when measuring national income? I will leave speculation as to the “why” to the readers and focus on the fact that we do count new Treasury Debt as income.

The modern concept of GDP was first developed by the Department of Commerce in 1934. Commerce commissioned Nobel Laureate Simon Kuznets of the National Bureau of Economic Research to develop a set of national economic accounts. Professor Kuznets headed a small group within the Bureau of Foreign and Domestic Commerce’s Division of Economic Research. I picture them meeting to develop statistical measures that would help the government to determine if the economy was recovering from the Depression. They are debating on how to measure all of the various sources of income. One economist suggests that regardless of the source of his income, there are only two things he can do… Spend it or invest it and we know how to measure consumption and investment (& savings). This was the foundation of the expenditure approach to measure GDP. I can imagine another one of the economists suggesting that when we sell more to other countries, the excess should be added to national income and subtracted if we buy more than we sell (Balance of Trade). Then another economist suggests that there is a third alternative to the idea that he will either spend or invest his income and that is paying taxes. Since the government takes a portion of National Income and spends it, they decided to add Government spending into the GDP calculations. While each component of this basic formula for GDP breaks down into hundreds or thousands of sub-components, the final calculation is:

GDP= PI + BT + GS

Where PI is private income (measured as consumption or investment)

Where BT is balance of trade

Where GS is government spending

So the final formula for GDP includes Government Spending. Notice that the government spending component does not take into account whether or not the government spent money taken out of private income (taxes) or borrowed it. When measuring National Income, we are giving equal weight to spending taxes on actual Private Income and money the Treasury borrows.

I suggest that government debt is not part of “ National Income” because it is not income. It is borrowed (often from sovereigns that are not our friends) and must be paid back eventually. We do not consider borrowed money as income anywhere else and it shouldn’t be considered as National Income. Debt is artificial stimulus not National Income! Governments must pay back debt either through higher taxes, inflation/depreciated currency, reduced services or some combination thereof. If we want an accurate picture of whether or not the economy is self sustaining, then we need to consider a measure I would like to introduce as “Actual National Income”which does not count artificial stimulus. Therefore to accurately measure the health of the economy, government debt must be subtracted from the formula. Please consider the GDP formula with the following modification.

Actual GDP = PI + BT + (GS – GB)

Where GB is government borrowing

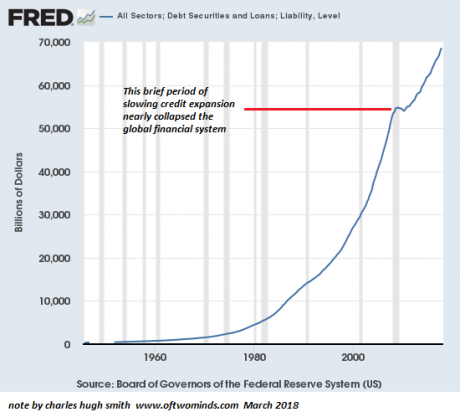
So, if you acknowledge for the sake of argument that government debt is not actual national income, the following graph is how the U.S. economy looks like excluding stimulus. This is Actual GDP excluding artificial stimulus.

The data and chart comes from the Federal Reserve Economic Data base (FRED.) It is Gross domestic Product minus Treasury Debt. If you download them to a spread sheet GDP is expressed in billions so 1,000,000,000 is expressed as 1, while Federal Debt is expressed in millions so 1,000,000,000 is expressed as 1,000. That is why the chart is (Gross Domestic Product * 1000.)

The government has always borrowed and spent money but actual GDP has grown as far back as the Fed has data. That is until 2008. Then something in our economy broke. Since then it appears the economy has been in what would be considered a depression but masked by huge Federal Government stimulus borrowing. Have we reached a level of economic activity that could sustain itself without this artificial stimulus? What would happen if the Government was forced to balance the budget? You decide for yourself, but remember that would remove 5-7% of our GDP. An economic depression is generally defined as a severe downturn that lasts several years. Does this look like a severe downturn that is still lasting several years? This is what our GDP minus artificial stimulus looks like.

Does that chart look like the data on a self sustaining recovery? If it were self sustaining the slope would be rising as it was prior to 2008. It continues to decline and is therefore anything but self-sustaining. In economics, deficit spending has long been called “Fiscal Stimulus.” Since 2008, this artificial stimulus has averaged 7.45% of GDP. The arithmetic (GDP-GB) is quite simple; without the artificial stimulus created by spending the proceeds of newly issued Treasury bonds, our GDP has declined an average of 7.45% each year since 2007! The following data/proof is downloaded from the source of the previous chart.

From 1929 to the end of the Great Depression and WWII, the Fed increased its balance sheet from 6% of GDP to 16% of GDP. From 2008 to 2014 the Fed grew its balance sheet from 6% of GDP to over 22% of GDP. The effective FED Funds target rate sank to 0-¼% band at the end of 2008 and stayed there until the end of 2015, when they went to 1/4-1/2% and stayed there a year. In fact, the Fed did not start serially raising rates until the end of 2016. Essentially, the Fed sat at the zero boundary for 8 years. Many wonder why they took so long to start the process of normalizing rates.

The FED has given us 8 years of “0” rates and almost twice as much of an increase in balance sheet expansion as they used in the Great Depression and WWII. Why? Did they see something that was more dangerous than the dual threats to the U.S.’s actual existence than the Great Depression and WWII combined? Or perhaps they were just engaged in a reckless and potentially dangerous monetary experiment? I have been asking those questions since the Fed’s balance sheet expansion exceeded that of the Great Depression & WWII. I believe what I have been describing as “ Actual GDP” may provide the answer. The Fed & the Government may have seen a depression that had the potential to be more threatening, deeper and longer than that of the 1930’s. If that assumption is correct, then the Fed & the Government have successfully masked a depression, avoiding a negative feedback loop and giving the economy time to heal. Has it healed? Please refer to the first graph “GDP minus Federal Debt” chart and tell me if you think the actual economy has healed. It is still heading down so I believe an informed and rational answer would be NO. If it has not healed one wonders what the Fed is doing.

In a report published on Wednesday August 30, 2017, titled “With A Shutdown, There Will Be Blood”, U.S. chief economist at S&P, Beth Ann Bovino, writes that “failure to raise the debt limit would likely be more catastrophic to the economy than the 2008 failure of Lehman Brothers and would erase any of the gains of the subsequent recovery.” I believe Bivino is on to something, even though we now have a temporary extension of the debt ceiling. With the Federal Government borrowing and spending over 6-7% of GDP, then it stands to reason that without the Government’s ability to borrow new money, GDP would collapse 6-7% before a negative feedback loop type mechanism is engaged making it worse. It is just arithmetic. Since 2010 the amount of net new Treasury Bonds issued has averaged 6.5% of GDP. If the Federal Government were unable to issue new bonds then that amount would no longer be in GDP. Again, It is just arithmetic.

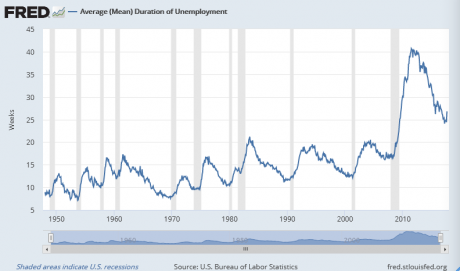
The labor market is reported as having created millions of jobs, but what kind of jobs? We often hear that we have full employment and a very tight labor market, that we have created so many jobs the Fed must raise rates. Since no one wants to raise a family working multiple part time jobs, let’s examine U.S. employment in terms of full time jobs,

The Federal Reserve data base (drawing on U.S. Bureau of Labor Statics) tells us there were 121,875,000 people employed with full time jobs in November of 2007 (just before the 2008 crises). As of August 2017 there were 125,755,000 people with full time jobs. That means our economy has added a paltry 3,880,000 full time jobs in almost 10 years as the population grew by about 23 million.

According to the National Center for Educational statistics there were 3,897,000 people who received a college degree including associates, bachelors, masters and PHDs in the school year 2016-2017.

The good news is that most of the people who graduated from college in the 2016/2017 school year can have full time jobs. The bad news is that in the 2016/2017 school year, those who dropped out of college, graduated from high school or dropped out of high school do not have a full time job. The really bad news is that everyone who graduated from college, who dropped out of college, graduated from high school or dropped out of high school from 2007 through 2016 do not have a full time job. There have not been enough full time jobs created in our economy for anyone out of high school or college in the last 9 out of 10 years. If the creation of enough full time jobs to employ only 1 year of college graduates out of 10 years sounds like a tight labor market to you and not a depression, then perhaps some of the readers would like you to share some of whatever you are smoking .

In conclusion, I believe the U.S. economy is in a depression masked by debt. I further believe there is no indication we have had an actual recovery of the actual economy.

These observations could inform intermediate and long term strategies. I am not using these observations as a timing tool, but rather as a depth finder for assessing risk when the next crisis unfolds or when market participants realize the emperor, not only has no clothes, he maxed out his credit cards buying them.


The Globalists Are Systematically Destroying America’s Middle Class

$
0
0

When people are dependent on the government they are much easier to control.  We are often told that we are not “compassionate” when we object to the endless expansion of government social programs, but that is not how the debate should be framed.  In America today, well over 100 million people receive money from the federal government each month, and the number of Americans that are truly financially independent is continually shrinking.  In fact, only 25 percent of all Americans have more than $10,000 in savings right now according to one survey.  If we eventually get to the point where virtually all of us are dependent on the government for our continued existence, that would give the globalists a very powerful tool of control.  In the end, they want as many of us dependent on the government as possible, because those that are dependent on the government are a lot less likely to fight against their agenda.

Back in 1992, the bottom 90 percent of American income earners brought in more than 60 percent of the country’s income.  But last year that figure slipped to just 49.7 percent.  The wealth of our society is increasingly being concentrated at the very top, and the middle class is steadily being eroded.  Surveys have found that somewhere around two-thirds of the country is living paycheck to paycheck at least part of the time, and so living on the edge has become a way of life for most Americans.

Earlier today, I came across a Business Insider article that was bemoaning the fact that the U.S. economy seems to be rather directionless at this point…

  • We do not have a real plan for health care, and costs continue to gobble up American wages.
  • We do not have a plan for dealing with globalization and economic change, but that change continues to shape our economy.
  • We don’t have a plan to update our decrepit infrastructure.
  • The one plan we did have — the Federal Reserve’s post-financial crisis program — is about to be unwound, marking the end of the last clear, executable plan to bolster America’s economy.

Ultimately, the truth is that we don’t actually need some sort of “central plan” for our economy.  We are supposed to be a free market system that is not guided and directed by central planners, but many Americans don’t even understand the benefits of free market capitalism anymore.

However, that Business Insider article did make a great point about globalization.   Most people don’t realize that our economy is slowly but surely being integrated into a global economic system.   This is really bad for American workers, because now they are being merged into a global labor pool in which they must compete directly for jobs with workers in other countries where it is legal to pay slave labor wages.

Even down in Mexico, many autoworkers are only making $2.25 an hour

Most of the workers at the new Audi factory in the state of Puebla, inaugurated in 2016 and assembling the Audi Q4 SUV, which carries a sticker price in the US of over $40,000 for base versions, make $2.25 an hour, according to the Union.

Volkswagen, which owns Audi, started building Beetles in Puebla in 1967 and has since created a vast manufacturing empire in Mexico, with vehicles built for consumers in Mexico, the US, Canada, and Latin American markets.

Volkswagen, Ford, GM, or any of the global automakers, which can manufacture just about anywhere in the world, always search for cheap labor to maximize the bottom line.

Would you want to work for $2.25 an hour?

Over time, millions of good paying jobs have been leaving high wage countries and have been going to low wage countries.  The United States has lost more than 70,000 manufacturing facilities since China joined the WTO, and this is one of the biggest factors that has eroded the middle class.

In a desperate attempt to maintain our standard of living, we have gone into increasing amounts of debt.  Of course our federal government is now 20 trillion dollars in debt, but on an individual level we are doing the same thing.  Today, American consumers are over 12 trillion dollars in debt, and it gets worse with each passing day.

The borrower is the servant of the lender, and most Americans have become debt slaves at this point.  This is something that Paul Craig Roberts commented on recently

Americans carry on by accumulating debt and becoming debt slaves. Many can only make the minimum payment on their credit card and thus accumulate debt. The Federal Reserve’s policy has exploded the prices of financial assets. The result is that the bulk of the population lacks discretionary income, and those with financial assets are wealthy until values adjust to reality.

As an economist I cannot identify in history any economy whose affairs have been so badly managed and prospects so severely damaged as the economy of the United States of America. In the short/intermediate run policies that damage the prospects for the American work force benefit what is called the One Percent as jobs offshoring reduces corporate costs and financialization transfers remaining discretionary income in interest and fees to the financial sector. But as consumer discretionary incomes disappear and debt burdens rise, aggregate demand falters, and there is nothing left to drive the economy.

This debt-based system continuously funnels wealth toward the very top of the pyramid, because it is the people at the very top that hold all of the debts.

Each year it gets worse, and most Americans would be absolutely stunned to hear that the top one percent now control 38.6 percent of all wealth in the United States…

The richest 1% of families controlled a record-high 38.6% of the country’s wealth in 2016, according to a Federal Reserve report published on Wednesday.

That’s nearly twice as much as the bottom 90%, which has seen its slice of the pie continue to shrink.

The bottom 90% of families now hold just 22.8% of the wealth, down from about one-third in 1989 when the Fed started tracking this measure.

So how do we fix this?

Well, the truth is that we need to go back to a non-debt based system that does not funnel all of the wealth to the very top of the pyramid.  Unfortunately, most Americans don’t even realize that our current debt-based system is fundamentally flawed, and it will probably take an unprecedented crisis in order to wake people up enough to take action.

Michael Snyder is a Republican candidate for Congress in Idaho’s First Congressional District, and you can learn how you can get involved in the campaign on his official website. His new book entitled “Living A Life That Really Matters” is available in paperback and for the Kindle on Amazon.com.

China’s Shadow-Lending Ecosystem Could Be As Large As $40 Trillion, PBOC Guesses

$
0
0

Authored by Deep Throat at Deep Throat Blog

Today, I'd like to take some time to revisit a couple of related topics that we first started discussing a few years ago. I am, of course, referring to the burgeoning increases in China's Debt levels, Shadow Bank Assets (loans) and M2, along with a high-level analysis of the most recent PBOC Financial Stability Report and FSB Global Shadow Bank Monitoring Report. (No!….please don't click this page closed….I promise this will eventually get interesting…)

As a starting point, let's begin by reviewing the February, 2015 McKinsey report  Debt and (not much) Deleveraging .  I first referenced the report in this blog in March of 2015. The report focused on the world's, and particularly China's, rapidly building debt/leverage phenomenon (2014 Year End Data).  I encourage you to re-read the entire report, but for those of you who are pressed for time, I'll give you the executive summary bullet-points right here:

  • Debt continues to grow  
  • Reducing government debt will require a wider range of solutions
  • Shadow banking has retreated, but non?bank credit remains important
  • Households borrow more
  • China’s debt is rising rapidly

I'm hoping that the McKinsey authors will consider updating the report, bringing the figures current, as I believe these observations, figures and analysis are even more pertinent today than they were back in 2015.

China's Debt

So now, using McKinsey as a reference point, let's take a look at where we are today, via the FRED (St. Louis FED)data below.

The FRED (Federal Reserve Economic Data – Citations below) Chart below represents US Core Debt (as defined and provided by the BIS – Bureau of International Settlements) compared to China Core Debt, as a percentage of GDP.  The third (bold Red) line represents China's debt levels adjusted for a "what-if" constant I'll explain shortly.

Lets dig into the numbers.  We see from 2006 thru 2016 US Core Debt increased modestly from roughly 220% of GDP to 250% of GDP.  However, China's Core Debt, relative to GDP nearly doubled during the same period, to roughly 260% of GDP.


Before we discus the above, let's talk about what GDP is (and isn't).  GDP is:

C+I+G+(NX) or:

(Consumption + Investment + Government Spending + (Exports-Imports)).  

First, it's important to understand that increased GDP does not necessarily increase wealth or improve quality of life.  A GDP calculation is measuring-stick for economic activity….nothing more.  A GDP figure makes no representations as to the quality, efficiency or economic utility of the activity producing the GDP.  i.e.) When my Dad was in the Army (WWII….the "big one") he talked about "practicing" digging fox holes.  He and thousands of other soldiers would be told/ordered to dig holes and fill them in…..for no apparent reason other than to keep them busy.  This activity, since he was being paid to do it, would increase GDP, even though it accomplished nothing more than wear them out and keep them out of the English pubs.

That said, here are a few examples of things that would significantly increase GDP.

  • Building a Superhighway, Bridge or Bullet Train connecting two uninhabited deserts or islands. (I+G)
  • Building a Ghost City. (I+G)
  • A military build up. (I+G)
  • Producing millions of tons of steel and cement held in a developer's CIP inventory. (I+G+C)
  • Creating even more manufacturing capacity (factories and mines) for steel, cement, etc.(I)
  • Building infrastructure.  i.e.) Public works, water, power plants, tunnels, wells, utilities etc. (I+G)
  • Manufacturing phones, computers, clothing and consumer goods for export. (C+NX)
  • Buying tons of eCommerce stuff. (C)
  • Tearing down an abandoned building/high rise. (C+G)

Here are a few more you might not think about…..again, these are events/activities that increase GDP but don't necessarily increase wealth or quality of life.

  • A hurricane….all of the destruction has to be financed and rebuilt. (C+I+G)
  • Public Welfare and Housing Assistance Checks (C+G)
  • Single Payer Health Care (C+G)
  • Paying 10x as much for a medical procedure as you might pay in other countries (C)

So you get the point…..although it looks good on paper, incurring debt to build/finance things that aren't economically viable, produce little (or no) economic utility or fail to generate earnings and cash flow doesn't work too well over the long haul.  At some point, the lenders won't be paid back…..or, as should happen in a free-floating world, if they are eventually paid back, they'll be paid back with a currency having a fraction of the purchasing power of the currency they initially loaned out to finance the activity.

China's "Productive GDP"

Now, let's get back to the bold Red line on the chart above and take some time to coin a phrase. We'll call it "Productive GDP" or PGDP.  As any economist will tell you, desperate times call for desperate measures…..and new terminology!  Let's say that China's "Productive" GDP, for lack of a better term, is defined as GDP excluding all of the over-building, non-productive excess capacity and accounting games created simply to hit the arbitrary 7%, etched in stone, silly, CCP mandated GDP growth target.

So let's further say that rather than the published, rock solid, 7%, annual NBS GDP growth rate, the "Productive", un-fudged, non-incentivized, PGDP growth rate is only 4.6%, (2/3rds of the published/reported rate), but still a remarkable number for an economy the size of China's.  Extrapolating the bold Red Line above, if GDP is "overstated" by a third, we illustrate/conclude that the ratio of Core Debt to "Productive" PGDP explodes to nearly 400%, much higher than the current G20 average of 240%.

Author's Note:  You math aficionados out there might be observing that the bold red line doesn't consider the compounding impact (i.e. reducing the GDP growth rate in a prior year impacts the current year starting point).  So the method illustrated (multiplying GDP by a constant) actually overstates GDP.  That's absolutely correct.  However, since I have no actual data to base my adjustment on, it's a guess, an arbitrary adjustment, so the compounding doesn't matter.  Besides using a constant was just simply easier than trying to program the FRED model to compound the change.  In any case, I'm just illustrating a point.

So far so good?

Shadow Banking

Now lets revisit the 2015 McKinsey Report (2014 data) bullet points above.  Specifically:

  • Shadow banking has retreated, but non?bank credit remains important

Unfortunately, per the People's Bank of China (PBOC), Shadow Bank lending has reversed course abruptly and skyrocketed since the 2015 McKinsey report.  Nobody really knows how big China's Shadow Bank ecosystem is, but the PBOC recently offered a rather shocking guess in their 2017 Financial Stability Report (pg.48).  China's Off-Balance-Sheet, un-regulated, "Shadow" loans have grown to nearly US $37 Trillion (RMB 252.3 Trillion) and have surpassed China's US$34 Trillion, "On-Balance Sheet" bank assets as of the close of 2016.  They also restated the 2015 numbers, increasing the 2015 figures to US$ 28 Trillion (RMB 189 Trillion), roughly doubling the 2015 figure.

Keep in mind, the PBOC estimating Non-Bank Shadow loans is a bit like the local Sheriff estimating "unreported financial crime".  He doesn't have authority over the mechanics of the activity, lacks enforcement resources and therefore can't do much about preventing the crime(s).  Even if he had authority and resource, he'd have a hard time zeroing in on the metric….criminals generally don't respond to surveys or self-report their schemes.  Moreover, the Sheriff would have an incentive to under-estimate the problem and hope everything works out, since, at some point, someone is going to be held accountable.  As history shows, and Chinese Bankers are well aware of this, financial scoundrels are normally exiled to horrific disgrace on a private tropical island with access to boatloads of Cayman Islands money…..so it goes.

Again, based solely on the usual, limited transparency inherent in PBOC reporting (good things are trumpeted and bad things are swept under the rug), a disclosure like this would indicate that the problem is potentially much larger than they are letting on.  In the 2017 Financial Stability Report (an oxymoron if I've ever heard one) the PBOC restates the Shadow Bank Assets for 2014 and 2015 (as shown by the dotted line in the chart below). To my knowledge, no other major economy has ever experienced an acceleration anywhere near these levels of Non-Bank, Shadow debt relative to GDP, much less restated it in a gigantic "ooppps….our bad" buried in a couple of paragraphs in the bowels of a report.  In China….they do things big.  The bigger the better.  The two Charts below, prepared by Capital Economics illustrate that we've apparently entered uncharted waters.

Although the fiercely independent citizens, politicians and bankers of Hong Kong and Singapore might disagree, we can generalize that the leverage in those economies (tall bars on the left of the chart) is inextricably linked to the Chinese financial system. If there were ever a potential "ground-zero" for a default-induced financial contagion Shang-Hong-apore would be it.

Moreover, when we examine the PBOC/CE Charts above, it wouldn't be much of a reach to conclude that Shadow/Non-Bank Credit has become an absolutely essential tool for keeping all of the financial balls in the air. As reported by Ambrose Evans-Pritchard in a piece for the Telegraph:

Jahangir Aziz and Haibin Zhu from JP Morgan said the debts of the state-owned entities (SOEs) have alone reached 90pc of GDP or $13.3 trillion.  

Nearly 60pc of new credit this year is being used to repay old loans. It takes four times as much new credit to generate a given amount of extra of GDP as it did a decade ago. “China’s rising indebtedness has come to represent all that is disconcerting about their economy,” they said in a report entitled “The Sum of All Fears”.

Hmmmm….."The Sum of All Fears"….catchy little title for a financial/policy report!  Tom Clancy would be proud….

Viewed another way, when we add the current, 2016 BIS figure, roughly US$28 Trillion of China's Core Debt plus the estimated US$37 Trillion +/- of Shadow debt (RMB 253.5 Trillion), we have a Debt/PGDP ratio approaching 900% of "Productive" PGDP.  The Comparable, relatively constant, US ratio (250% +/-) is shown in blue below.

"Total Social Financing" (TSF)

Total Social Financing (TSF), a term of art the Chinese government introduced a few years ago to track the leverage in their economy, grew to RMB 155.99 trillion RMB (US$ 23 Trillion),  up 12.8 percent from 2015, per the PBOC Report. (Pg. 28)  The intent of this statistic is to track the "total financing" required by households and businesses.  The process goes awry when we try to decipher exactly what's included in this metric and how the data is collected.  There are numerous articles written on this topic and I've listed a few of them in the citations below.  Suffice it to say that the consensus is, that a significant amount of Non-Bank Shadow financing is excluded from TSF.  Interestingly, this metric, intended to show changes in the composition of how economic growth is financed, is actually misleading, since significant Shadow risk is omitted from the calculations.

Some Verifiable Numbers…..Bonds

As difficult as it is to measure China's fragmented Shadow Financial System, there are a few reported metrics which are presumably more reliable than others.  China's bond markets are one such example.  In the last two years (2015 & 2016) the value of new "Major" Chinese Bond issues (below) has actually exceeded the total amount outstanding of America's Corporate Bond market (about US$ 8.6 Trillion).  Why is all of this new debt necessary?  Again, most (60%?) of the new issues are used to roll over other bonds/debts/financing coming due.

Continuing the theme, Non-Performing Loans (NPL's) have somehow remained relatively constant, hovering just under 2% since 2011 as shown below.  (pg. 44 of the PBOC Report)

How can this be?  Perhaps it's just little old skeptical me, but usually, when borrowing skyrockets like this, underwriting is lax and bad loans go bad much quicker.  The universally accepted game bankers play to keep a bad loan from being reported as non-performing is to refinance it and change the terms….and (drum roll please….) ….like magic, it's a performing loan again!  In all likelihood, that's what's happening with this fake NPL statistic.  It's hard to believe that China's financial system hasn't already broken its economic foot as a consequence of kicking all of these NPL cans down the road, but somehow it just keeps chugging merrily along.  As my favorite Irish pub drinking song goes…."Roll me over in the clover…..roll me over lay me down and do it again…this is number one….we've only just begun….."

Economic Slowdown Confirmed: The U.S. Economy Lost Jobs Last Month For The First Time In 7 Years

$
0
0

Don’t worry – even though the employment numbers are terrible the mainstream media insists that everything is going to be wonderful for the U.S. economy in the months ahead.  According to the Bureau of Labor Statistics, the U.S. economy lost 33,000 jobs during September.  That was the first monthly decline in seven years, and as you will see below, overall 2017 is on pace for the slowest employment growth in at least five years.  But the Bureau of Labor Statistics insists that the downturn in September was due to the chaos caused by Hurricane Harvey and Hurricane Irma, and they are assuring us that happier times are right around the corner.

Economists were projecting that we would see an increase of around 80,000 jobs last month, and we need to add at least 150,000 jobs each month just to keep up with population growth.  So the -33,000 number was a huge disappointment.

But even though we lost 33,000 jobs last month, the Bureau of Labor Statistics says that the unemployment rate fell from 4.4 percent to 4.2 percent.

Yes, I know that doesn’t make any sense at all, but that is what they are telling us.

Perhaps if several volcanoes go off inside this country, terrorists detonate a dirty bomb in one of our major cities and Godzilla invades the west coast next month the unemployment rate will drop all the way to zero.

Of course I am being facetious, but I just want to point out the absurdity of what we are being told.  There is no way in the world that the official unemployment rate should be at “a new 16-year low”.

In the end, perhaps September will end up being a bit of an anomaly.  But as I mentioned above, we have been witnessing a broader trend build for months.  According to CNBC, we are on pace for “the slowest jobs growth in at least five years”…

In addition to September’s rough month, the July number was revised lower from 189,000 to 138,000 though August got a bump higher from 156,000. In all, though, 2017 thus far has seen the slowest jobs growth in at least five years.

Let that sink in for a moment.

Employment is not booming.  In fact, things haven’t been this slow “in at least five years”.  An economic slowdown is here, and yet most people are totally oblivious to what is happening.

And let me share something else with you.  The following chart shows the average duration of unemployment since the late 1940s…

This chart shows that workers remain unemployed far longer than they did in the “good old days”, but I want you to pay special attention to the very end of the chart.

The duration of unemployment is really starting to spike up again quite dramatically, and that is a very, very troubling sign for the U.S. economy overall, because spikes in this number almost always correspond with recessions.

But the Bureau of Labor Statistics says that we don’t have anything to be concerned about.  In fact, they are blaming all of the bad numbers from last month on Harvey and Irma

Our analysis suggests that the net effect of these hurricanes was to reduce the estimate of total nonfarm payroll employment for September. There was no discernible effect on the national unemployment rate. No changes were made to either the establishment or household survey estimation procedures for the September figures. For both surveys, collection rates generally were within normal ranges, both nationally and in the affected states. In the establishment survey, employees who are not paid for the pay period that includes the 12th of the month are not counted as employed. In the household survey, persons with a job are counted as employed even if they miss work for the entire survey reference week (the week including the 12th of the month), regardless of whether or not they are paid. For both surveys, national estimates do not include Puerto Rico or the U.S. Virgin Islands.

And the “experts” that are being quoted by the mainstream media are assuring us that “the labor market remains in good shape”

“Despite the decline (in job gains), it’s really clear that the labor market remains in good shape,” says Joel Naroff of Naroff Economic Advisors.

The unemployment rate, which is calculated from a different survey than the headline job totals, edged lower. That’s because gains in the number of people employed outpaced an increase in the labor force, which includes people working and looking for jobs. In that survey of households, workers are counted as employed even if they were temporarily idled by the storms.

Hopefully they are right.

Hopefully happy times are here again and an economic boom is right around the corner.

Unfortunately, the longer term trends tell an entirely different story.  Our economic infrastructure has been gutted, we have shipped millions of good paying jobs overseas, the middle class is slowly being eradicated, and we are living in the terminal phase of the greatest debt bubble in human history.

We have been able to maintain our ridiculously inflated standard of living for an extended period of time by borrowing absolutely colossal mountains of money year after year.  But no debt bubble lasts forever, and this one will not either.

The debt-fueled “prosperity” that we see all around us today is an enormous temporary illusion, and when the illusion collapses the economic pain is going to be greater than anything we have ever seen before in modern American history.

Michael Snyder is a Republican candidate for Congress in Idaho’s First Congressional District, and you can learn how you can get involved in the campaign on his official website. His new book entitled “Living A Life That Really Matters” is available in paperback and for the Kindle on Amazon.com.

“You May Be Hopping Mad When You Finish Reading This”

$
0
0

Submitted by John Mauldin of Mauldin Economics

Uncle Sam’s Unfunded Promises

Here’s a surprisingly profound question: What is a promise? Dictionaries offer various definitions. I like this one: “An express assurance on which expectation is to be based.”

That definition captures the two-sided nature of a promise. One party offers an assurance, which the other converts into an expectation. You deposit money in your checking account, and the bank assures you that you can have it back on demand. You expect that the bank will fulfill its promise when you visit an ATM.

Governments likewise make promises, but those are different. Government is the ultimate enforcer of promises, but we have no recourse if it chooses to break them – except at the ballot box. As we’ve seen in recent weeks regarding public pensions, that’s ineffective when the promises were made long ago by officials who are no longer in office.

The federal government’s keeping its promises is important for everyone in the US, because almost all of us are part of the largest public pension system: Social Security. We pay taxes our whole working lives and expect the government to give us retirement benefits. But what happens if it can’t?

Three weeks ago we visited the problems with local and state pensions. Last week we looked at European pensions. This week we are going to take a hard look at the unfunded liabilities and debt of the US government. And even though the federal unfunded pension liabilities dwarf those of state and local pensions, I want to make it clear that I believe the state and local problems will be far more intractable.

I have to warn you: You may be hopping mad when you finish reading this.

* * *

Doubled Debt

In the United States we have two national programs to care for the elderly. Social Security provides a small pension, and Medicare covers medical expenses. All workers pay taxes that supposedly fund the benefits we may someday receive. That’s actually not true, as we will see in a little bit.

Neither of these programs is comprehensive. Living on Social Security benefits alone is a pretty meager existence. Medicare has deductibles and copayments that can add up quickly. Both programs assume people have their own savings and other resources. Nevertheless, the programs are crucial to millions of retirees, many of whom work well past 65 just to keep up with their routine expenses. This chart from my friend John Burns shows the growing trend among generations to work past age 65. Having turned 68 a few days ago, I guess I’m contributing a bit to the trend:

Limited though Social Security and Medicare are, we attribute one huge benefit to them: They’re guaranteed. Uncle Sam will always pay them – he promised. And to his credit, Uncle Sam is trying hard to keep his end of the deal. In fact, he’s running up debt to do so. Actually, a massive amount of debt:

Federal debt as a percentage of GDP has almost doubled since the turn of the century. The big jump occurred during the 2007–2009 recession, but the debt has kept growing since then. That’s a consequence of both higher spending and lower GDP growth.

In theory, Social Security and Medicare don’t count here. Their funding goes into separate trust funds. But in reality, the Treasury borrows from the trust funds, so they simply hold more government debt.

The Treasury Department tracks all this, and you can read about it on their website, updated daily. Presently it looks like this:

  • Debt held by the public: $14.4 trillion
  • Intragovernmental holdings (the trust funds): $5.4 trillion
  • Total public debt: $19.8 trillion

Total GDP is roughly $19.3 trillion, so the federal debt is about equal to one full year of the entire nation’s collective economic output. In fact, it’s even more when you consider that GDP counts government spending as “production,” even when Uncle Sam spends borrowed money. Of course, that total does not count the $3 trillion-plus of state and local debt, which in almost every other country of the world is included in their national debt numbers. Including state and local debt in US figures would take our debt-to-GDP above 115%. And rising.

You can quibble over the calculations, but there’s no doubt the numbers are astronomically huge and growing. And we haven’t even mentioned the huge and growing private debt.

Just wait. We’re only getting started.

Yes, Trillions

We in the business world put a lot of faith in accountants. We trust them to count the beans honestly and give us accurate reports. We may not like the numbers (I was certainly distraught with my final tax numbers this year!), but we mostly believe them. Nothing will make a company’s stock drop faster than accounting irregularities will.

Government accounting is, well, different. The government doesn’t need to make a profit, but we expect it to spend our tax money wisely and to deliver services efficiently. That’s not possible unless there is reliable accounting. But reliable accounting is the last thing most politicians want – it constrains them from promising things they can’t deliver. So we have to take all government numbers with many grains of salt.

However, there is one chink in the politicians’ armor. An old statute requires the Treasury to issue an annual financial statement, similar to a corporation’s annual report. The FY 2016 edition is 274 enlightening pages that the government hopes none of us will read.

Among the many tidbits, it contains a table on page 63 that reveals the net present value of the US government’s 75-year future liability for Social Security and Medicare. That amount exceeds the net present value of the tax revenue designated to pay those benefits by $46.7 trillion. Yes, trillions.

Where will this $46.7 trillion come from? We don’t know. Future Congresses will have to find it somewhere. This is the fabled “unfunded liability” you hear about from deficit hawks. Similar promises exist to military and civil service retirees and assorted smaller groups, too. Trying to add them up quickly becomes an exercise in absurdity. They are so huge that it’s hard to believe the government will pay them, promises or not.

Now, I know this is going to come as a shock, but that $46.7 trillion of unfunded liabilities is pretty much a lie. My friend Professor Larry Kotlikoff estimates the unfunded liabilities to be closer to $210 trillion. When presidential candidate Ben Carson last year quoted Kotlikoff’s numbers, the Washington Post, New York Times, and other mainstream media immediately attacked him. Of course, the journalists doing the attacking had agendas, and none of them were economists or accountants. None. Zero. Zip.

Larry responded in an article in Forbes, since Carson was using his data:

The fiscal gap is the present value of all projected future expenditures less the present value of all projected future taxes. The fiscal gap is calculated over the infinite horizon. But since future expenditures and taxes far off in the future are being discounted, their contribution to the fiscal gap is smaller the farther out one goes. The $210 trillion figure is based on the Congressional Budget Office’s July 2014 Alternative Fiscal Scenario projections, which I extended beyond their 75-year horizon.


The journalists used a very poorly researched analysis, which fit their political bias (shocking, I know). Apparently they take that fabricated analysis more seriously than they do the views of 17 Nobel Laureates in economics and over 1200 PhD economists from MIT, Harvard, Stanford, Chicago, Berkeley, Yale, Columbia, Penn, and lesser known universities and colleges around the country. Each of these economists has endorsed The Inform Act, a bi-partisan bill that requires the CBO, GAO, and OMB to do infinite horizon fiscal gap accounting on a routine and ongoing basis.


Now why would 17 Nobel Laureates and over 1200 US economists, all listed by name at www.theinformact.org, including many, like Jeff Sachs, who lean to the left, and others, like Glenn Hubbard, who lean to the right, endorse infinite horizon accounting. Because they understand something that I told Michelle repeatedly and have also told Bruce Barlett repeatedly. The fiscal gap is the only measure of our fiscal position that is mathematically well-defined.


Every other fiscal measure, including fiscal gaps calculated over any finite horizon, such as the CBO’s 25-year fiscal gap Michelle references, are not mathematically well defined. The infinite horizon is mathematically well defined because it is the same number no matter what choice of internally consistent fiscal words we use to label government receipts and payments. Moreover, the infinite horizon fiscal gap is the only measure of our fiscal policy’s sustainability that puts everything on the books. It is also the only measure of our fiscal policy’s sustainability that is invariant to the choice of words.


Congress’s choice of fiscal labels determines what gets put on and what gets kept off the books. I told Michelle that her grandparents’ Social Security benefits, for which she is now paying taxes, are not on the books because the government chose to call those payments “transfers” paid in exchange for “FICA contributions” not “return of principal plus interest” paid in exchange for “purchase of government bonds.”


Every mathematical model of the economy’s dynamic transition path incorporates the infinite horizon fiscal gap, which is called the government’s infinite horizon intertemporal budget constraint. This constraint has to hold, which means the infinite horizon fiscal gap must be zero. Our country’s infinite horizon fiscal gap is far from zero. It would take an immediate and permanent 59 percent increase in all federal taxes or an immediate and permanent 33 cut in all federal expenditures (including official debt service) to eliminate our fiscal gap. The longer we wait to fix our fiscal system, the larger the adjustment needs to be. This means that (the journalist), and others her age, will need to pay even more for all the “assets,” including my own Medicare and Social Security benefits that have been left off the books.


Yes, something will have to give.

The $210 Trillion Gap

I will admit that I’m not worried about the $210 trillion in unfunded liabilities. Long before we ever get to having to fund those liabilities, the country will be in a massive crisis.

Using the CBO’s own numbers, the projected total US debt will be $30 trillion within 10 years, but the CBO also makes the rosy assumptions that there will be no recessions and that GDP will grow at a 4% nominal rate. Now, that’s possible; but I’m inclined to haircut it a bit.

If you asked me to bet the “over/under” on the debt in 2027, I would bet the over at $35 trillion. After the next recession the deficit will be $30 trillion within 4–5 years and then grow from there at a rate of anywhere from $1.5 to $2 trillion per year. Note: That is not the CBO’s projected debt. It does not count the off-budget deficit that still ends up having to be borrowed. Last year the deficit was well over $1 trillion – but we were told it was in the neighborhood of $600 billion. If any normal company tried to use accounting like the US Congress does, the SEC would rightly declare it fraudulent and shut it down immediately. .

Here’s another chart from the Treasury’s annual financial report, projecting government receipts and spending:

Note that this chart expresses the various items as percentages of GDP, not dollars. So the relatively flat spending categories simply mean they are forecasted to grow in line with the economy, or just a little faster. But the space representing net interest grows much faster than GDP does – fast enough to make total federal spending add up to one-third of GDP by 2090.

Obviously, this chart is based on all kinds of assumptions, and reality will be far different. I doubt we will make it to 2090 (or even 2050) without at least one global depression or other calamity that radically resets all the assumptions. Beneficial changes are also possible – biotech breakthroughs that reduce healthcare expenditures, for instance.

Still, looking at the demographic reality of longer lifespans and lower birthrates, it’s hard to believe Social Security can survive over the long run in anything like its present form. But any major change will mean that the government is breaking its promise to workers and retirees.

Well, guess what: They backtracked on that promise decades ago. Few people noticed it at the time, and even fewer remember it now.

Tax, Not a Promise

There’s a big difference between that federal government financial statement and similar ones from private companies. “Liabilities” for a business represent contracts it has signed – the long-term lease on a building, for instance. The company agrees to pay so many dollars a month for the next 20 years. That obligation is enforceable in court. Even if the company enters bankruptcy, the court will award creditors damages from whatever assets it can recover.

The federal government doesn’t work that way. It signs contracts all the time – but often with escape clauses that private businesses could never get away with. Social Security is a good example.

Many Americans think of “their” Social Security like a contract, similar to insurance benefits or personal property. The money that comes out of our paychecks is labeled FICA, which stands for Federal Insurance Contributions Act. We paid in all those years, so it’s just our own money coming back to us.

That’s a perfectly understandable viewpoint. It’s also wrong.

A 1960 Supreme Court case, Flemming vs. Nestor, ruled that Social Security is not insurance or any other kind of property. The law obligates you to make FICA “contributions.” It does not obligate the government to give you anything back. FICA is simply a tax, like income tax or any other. The amount you pay in does figure into your benefit amount, but Congress can change that benefit any time it wishes.

Again, to make this clear: Your Social Security benefits are guaranteed under current law, but Congress reserves the right to change the law. They can give you more, or less, or nothing at all, and your only recourse is the ballot box. Medicare didn’t yet exist in 1960, but I think Flemming vs. Nestor would apply to it, too. None of us have a “right” to healthcare benefits just because we have paid Medicare taxes all our lives. We are at Washington’s mercy.

I’m not suggesting Congress is about to change anything. My point is about promises. As a moral or political matter, it’s true that Washington promised us all these things. As a legal matter, however, no such promise exists. You can’t sue the government to get what you’re owed because it doesn’t “owe” you anything.

This distinction doesn’t matter right now, but I bet it will someday. If we Baby Boomers figure out ways to stay alive longer, and younger generations don’t accelerate the production of new taxpayers, something will have to give.

If you are depending on Social Security to fund your retirement, recognize that your future is an unfunded liability – a promise that’s not really a promise because it can change at any time. 

How Will We Fund the Deficit?

And now we come to the really uncomfortable part. Notice that Larry Kotlikoff said we would need an immediate approximately 50% increase in taxes to fund our future deficits. That’s what we would need to create a true entitlements “lockbox” with the funds actually in it. But surely everybody knows by now that there is no lockbox with Social Security funds in it. That money was spent on other government programs and debts. And so when the CBO doesn’t count the trust funds as part of the national debt, they are not only being disingenuous, I think they are committing financial fraud. The money that will actually pay for Social Security and Medicare down the road is going to have to come out of future taxes, just as for any other debt of the US.

So at some point – even though Republicans are jawboning hard about cutting taxes now – we are going to have to raise taxes in order to fund Social Security and Medicare. I personally think it will have to be done with a value-added tax (VAT), because the necessary increase in income taxes would totally destroy the economy and potential growth.

(And yes, I know some of you will write back and say we had much higher tax rates in the 50s and we had good growth then, but our demographics and productivity levels were completely different in that era. Plus, nobody actually paid the highest tax levels. I remember that in the 80s, before Reagan cut the tax rate, I had so many deductions that my effective tax rate was about 15%. The irony is that after the Reagan tax cuts, my total tax payments went up, not down – I lost all of my cool deductions! Aaah, the good old days…)

But the simple fact of the matter is that no Congress is going to fund Social Security and Medicare through tax hikes. Before they ever go there, they will means-test Social Security and increase the retirement age – which they should.

Of course, Congress could always authorize the Treasury Department to authorize the Federal Reserve to monetize a certain amount of the Social Security and Medicare debt, which is essentially what Japan is doing (and seemingly getting away with it). I think we should all be grateful to the Japanese for being willing to undertake such a fascinating experiment in monetary and fiscal policy.

Let me close with a quick sidebar note. I think the Fed’s mad rush to raise rates and reduce its balance sheet at the same time is unwise. I mean, seriously, is the Federal Reserve balance sheet making that much of a difference to the US economy? Perhaps when that extraordinary balance was created, it did – but not today. This is one of those times when I think our policy makers should go slowly and tread carefully. Just saying…

“Game Changer”

$
0
0

Authored by Paul Brodsky via Macro-Allocation.com,

Investors understand that asset markets are experiencing dynamic change (think ETFs), but have not yet broadly recognized that the fundamental nature of wealth itself is changing too. Before the decline of active asset management runs its course there will be an imperative to focus on active currency management. Wealth maintenance and creation demands a clear understanding of this transformation. 

Debt Tokens 

The majority of us are not as rich as we think. Our wealth is held in debt tokens or assets denominated in them with increasingly dubious prospects. Some accounting identities are in order.

Classically, an asset is something with intrinsic value that transcends time and money. It has some value no matter how or when one measures it. Only two people – a potential buyer and seller – need to value something for it to be an asset.

A currency, meanwhile, is a unit of account that provides users with a means of measuring and exchanging value. In a hypothetical barter economy, production itself is would be currency. Currencies representing saved wealth are necessary because we need to value goods, services and assets relative to each other.

Modern currencies are widely misunderstood. They are actually the product of bank system double-entry accounting – ultimately un-reserved, 100 percent faith-based obligations of centralized entities (governments, central banks or currency boards) to manufacture enough actual base money in the future (i.e., inflate) to settle all claims for money that was already created by private banks through the lending process. It is important to note that credit and credit-currencies are claims on money, not claims on assets. Depending upon how one counts, there is either 3 times (M2), 5 times (bank assets), 12 times (total credit market debt), or 25 times (total unfunded liabilities) the amount of claims on US dollars than the amount of actual US dollars in existence (base money). There are no plans to remedy this overwhelming leverage. In fact, this month the Fed is beginning to increase currency leverage again by reducing the size of its own balance sheet, which will effectively re-leverage banks by reducing bank reserves.

This state of monetary affairs is a big deal for financial asset investors. As it stands today, investors could not hypothetically exchange all assets (or liabilities) for base money, or even for credit currencies (M2), at or near current prices. To do so, banking systems would have to first create new liabilities, which in turn would dilute and diminish the purchasing power value of currencies in which assets are denominated.

To be good money, a currency must also be a store of value, meaning it also has to be an asset or be backed by an asset. In the current regime, there are no assets with quantifiable value directly associated with fiat currencies…other than the ability to tax.

The ability to tax is indeed an asset of governments, but one with greatly diminished value. In the US, fiscal year 2016 tax revenues were $3.3 trillion.1 Meanwhile, baseline government spending was about $3.4 trillion, including $1.06 trillion for Medicare and Medicaid; $910 billion for Social Security; $600 billion for non-defense discretionary spending to fund federal departments and agencies; $585 billion for the Defense Department; and $240 billion for interest on federal debt.2 These expenditures are rising faster than tax revenues and do not include truly discretionary government spending. (It seems legislators only have true discretion over how they deficit-spend.) 

While the incalculable value of assets of the United States government (including its strong military and hegemonic control over shipping lanes and bilateral trade) may exceed its currency obligations, such assets cannot be transferred to creditors (i.e., dollar holders) to satisfy obligations. Thus, from both stock (leverage) and flow (budget deficit) perspectives, the US dollar is a very poor credit in real terms. Indeed, other fiat currencies may be worse and all of them are effectively unreserved debt tokens.

The quantity of systemic liabilities – including debt-based credit and credit-currencies – has come to vastly exceed the forward real value of unencumbered assets (adjusted for necessary currency devaluation). It is not possible to net all assets against all liabilities without dramatically reducing the real purchasing power value (PPV) of assets. What does this imply for assets denominated in credit-currencies? Today’s wealth has been borrowed to such an extent that it cannot be broadly recognized in the currencies in which assets are currently denominated. Looking forward, we think the most influential input into wealth creation will be getting the underlying currency right.

If today’s currencies are, in realty, unreserved debt tokens, and assets are denominated and measured in them, then how does one value assets in real terms? Here’s three-step logic we think makes sense:

1. Take the nominal value of an asset priced in a certain currency


2. Adjust the nominal value by the implicit leverage embedded in that currency


3. Present Value the future nominal cash flows of the asset against future currency dilution

Applying this metric makes clear that assets – equity, debt, plant, equipment, labor, goodwill, whatever – priced in certain currencies may hold significantly more or less value today than similar assets priced in other currencies with similar nominal asset valuation metrics (i.e., P/Es, Price to Book, Cap Rates, etc.).

Not surprisingly, assets have taken on many of the qualities of currencies, which makes sense given that both are effectively unfunded obligations. Neither assets nor currencies can have intrinsic value. Currencies may only be valued against other currencies and assets may only be valued against other assets. Is it any wonder that financial asset markets have become places to “save” and that low-cost passive investment vehicles like ETFs are becoming the vehicles of choice? It was inevitable that today’s government-sponsored, bank-executed monetary system would eventually be disintermediated, and the shift to “saving” through passive investing in asset markets is a step in that process.

Value Exchange

What happens when value begins to be exchanged directly on the internet itself, rather than through centralized portals that sit atop it like toll booths? Block chain technology is effectively an open source triple-entry accounting system that includes all participants in the value transfer process. The combination of the technology, its applications, and its accessibility are genuinely transformative.

What will happen to the value of highly-leveraged credit-currencies relative to less leveraged or zero leveraged stores of value that arise from this transformation? What will happen to Foreign Exchange (FX) cross rates in a peer-to-peer world where nothing is foreign? What about the real value of assets?

Looking forward, a growing portion of value, regardless of what form it takes, will be exchanged peer-to-peer, and any value leftover will be stored in whichever form counterparties agree – fiat currencies, cryptocurrencies, commodity-backed currencies, maybe even direct claims for commodities, goods, services or equity.

Value Exchange (VX) rates could look something like the hypothetical table below:

Table 1: Hypothetical Value Exchange Rate (VX) Table – 2027

We should expect value to flow directly between producers and consumers of that production, rather than through public and private sector intermediaries charging them rent. Rentiers and sovereign authorities will formally embrace this brave new world – not out of a sense of altruism, but because the technology is already here and human incentives cannot be denied.
 

Robert Gore’s “Hard Core Doom Porn”

$
0
0

Authored by Robert Gore via Straight Line Logic blog,

It will be a crash like we’ve never seen before.

SLL has been accused of trafficking in “doom porn.” Guilty as charged. If you don’t like doom porn, don’t read this article, it’s hard core. If you prefer feel good and heartwarming, there are plenty of Wall Street research reports and mainstream media stories about the economy available. Enjoy!

In 1971, President Nixon closed the “gold window,” which allowed foreign governments to exchange their dollars for gold. This severed the last link between any government and central bank-created debt and the real economy. Debt could be conjured at whim, and governments and central banks have done so for the last 46 years.

Not surprisingly, credit creation without restraint has papered the globe with the greatest pile of debt mankind has ever amassed, measured in nominal terms or relative to the underlying economy. A measure of how extraordinary this situation is: most people regard it as normal, if they think of it all. Debt is a first mover, a financial constant. Any exigency small or large can be met from an unlimited credit pool that will always be with us. How to rebuild Houston, Florida, and Puerto Rico? No problem, borrow.

Although fiat credit creation by governments and central banks is unconnected to the real economy, its effects are not. Their debt becomes an asset within the financial system. Through fractional reserve banking, securitization, and derivatives it become the basis for a multiplication of the original debt. That multiplication is many times the multiplier (the reciprocal of the reserve requirement) taught in introductory macroeconomics classes whereby the debt is contained within the banking system.

Nominal global debt is reckoned at between $225 and $250 trillion, or about three times global GDP. Financial, debt-supported derivatives (financial instruments whose prices are derived from the prices of other financial instruments) are estimated at anywhere from $500 trillion to $1 quadrillion notational, or six to twelve times global GDP.

Overpriced houses did not cause the last financial crisis and almost bring down the world’s financial system, securitized packages of mortgages and their associated derivatives did. The Panglossian view of derivatives is that most of them can be netted out against offsetting derivatives, thus actual exposures are far less that notational amounts. The real world view is they can only be netted out as long as all counterparties remain solvent. As we learned in 2009, that is not always a correct assumption.

Globally, unfunded old age pension and medical liabilities, not counted as debt but still promises made that often have the force of law, sum to another $400 trillion. In the US, they are about $210 trillion, or about 11 times US GDP. Demographics amplify the liability: across the developed world, declining birth rates and extensions in life expectancies mean a shrinking pool of workers supports an expanding pool of beneficiaries. In the last month, SLL has posted four excellent articles by John Mauldin for those who want all the gruesome details. (Just enter John Mauldin in SLL’s search box and they’ll pop right up.)

This doom porn, the skeptics will say, is almost as old as Deep Throat (released in 1972). Markets crash from time to time, but they always bounce back. Central banks and governments come to the rescue with fiscal stimulus (increased government debt) and unlimited fiat debt.

Why should we worry now?

There are a number of reasons.

When the world was less indebted, a fiat currency unit’s worth of debt produced more than a fiat currency unit’s worth of expanded output of goods and services. Sometime within the last year or two, the marginal economic effectiveness of all that government and central bank debt reached zero, and is negative after debt service.

With the world saturated in debt, another fiat currency unit of debt produces no increase in output. Kick in the costs of servicing and repaying that debt, and increasing debt is actually retarding economic growth. It accounts for the long-term slowing growth trend, flat incomes, and “secular stagnation” that puzzle so many economists.

It also accounts for the lack of inflation that puzzles so many central bankers, at least in the price indexes they look at. They are looking at the wrong indexes. The relevant indices are stock, high-grade bond, real estate, and cryptocurrency prices, still at or close to record highs, and corporate and securitized-debt credit spreads to treasury benchmarks at record lows (indicating massive complacency about corporate credit risk). Here inflation—the speculative kind that blows bubbles—is alive and thriving.

With the Federal Reserve now taking steps to shrink its balance sheet and other central banks making noises about doing the same, global fiat debt creation may go into reverse for the first time in many years. Brandon Smith at Alt-Market.com argues that this is part of plan leading to a crash and global, centralized monetary control.

He may or may not be on to something, however, valuation extremes and sentiment indicators point to the same conclusion concerning a crash. SLL maintains financial markets are exercises in crowd psychology, impervious to government and central bank efforts to control them, designed to separate the maximum number of speculators from a maximum amount of their money.

Robert Prechter, of Elliott Wave International, has written the chapter and the verse on markets and psychology. (SLL reviewed his groundbreaking tome, The Socionomic Theory of Finance.) Consider the following from Elliot Wave International’s October “Financial Forecast.”

Every month another sentiment indicator seems to pop to a frothy new extreme. Last month it was the percentage of cash that members of the American Association of Individual Investors harbored in their investment portfolios. At 14.5%, it was the smallest allocation to this safe alternative since January 2000, the same month that the Dow Industrials began a 38% decline that lasted through October 2002. Last month, we also showed a new bullish extreme for the five-day average of Market Vane’s Bullish Consensus survey of advisors. On September 15, the average pushed to 71%, a new ten-year extreme.


The most recent Commitment of Traders Report shows that Large Speculators in futures on the CBOE Volatility Index (VIX) have amassed a record net- short position of 172,395 contracts.


This record bet on subdued volatility sets the stage perfectly for the period of “high volatility” that EWFF called for in August.


…Large Speculators in the E-mini DJIA futures have pushed their net-long position to 95,976 contracts, more than four times the number of contracts they held in January 2008, shortly after the Dow started its largest percentage decline since 1929. So, investors are betting to a record degree that the stock market will continue to rise and volatility will continue to remain subdued. Paradoxically, these measures indicate that exact opposite.


…Various media accounts confirm that a rare complacency now dominates the stock market.

One doesn’t have to buy in to socionomics to realize that virtually everyone is now on the same side of the boat, a condition generally followed by the boat capsizing. Using conventional valuation measures, the only time stocks have been more highly valued is just before the tech wreck in 2000.

If one does buy into socionomics, the last few upward squiggles in the stock market will put the finishing touches on intermediate, primary, cycle, supercycle, and grand supercycle Elliot Waves dating back to 2016, 2009, 1974, 1932, and the 1780s, respectively. In other words, this is going to be a crash for the ages.

Given the unprecedented level of global debt, that appears to be the most likely scenario. Every financial asset in the world is either a debt claim or an even less secure equity claim—a claim on what’s left after debt is paid. Much of the world’s real, tangible assets are mortgaged.

When the debt bubble implodes, a global margin call will prompt forced selling, driving down all asset prices precipitously. Most of what is currently regarded as wealth will vanish. Opening up the world’s fiat debt spigots full force won’t stop this one. The notions that governments and central banks have speculators’ backs, that problems caused by excessive debt can be solved with more debt, will be revealed as monumental follies. And markets will not come back, at least in our lifetimes.

Long-time readers will point out that SLL has been issuing warnings for years. Again, guilty as charged. However, we’ll join Mr. Prechter and company in their prediction that US equity markets top out before the end of this year. (They called last year’s top in the government bond market, adding to an impressive list of correct calls.) If we’re wrong, it won’t be the first or last time. If we’re right, given the magnitude of what’s coming, being a few years early won’t matter at all.

Our concluding clichés: fear is stronger than greed and markets go down much quicker than they go up.

How The Elite Dominate The World – Part 1: Debt As A Tool Of Enslavement

$
0
0

Throughout human history, those in the ruling class have found various ways to force those under them to work for their economic benefit.  But in our day and age, we are willingly enslaving ourselves.  The borrower is the servant of the lender, and there has never been more debt in our world than there is right now.  According to the Institute of International Finance, global debt has hit the 217 trillion dollar mark, although other estimates would put this number far higher.  Of course everyone knows that our planet is drowning in debt, but most people never stop to consider who owns all of this debt.  This unprecedented debt bubble represents that greatest transfer of wealth in human history, and those that are being enriched are the extremely wealthy elitists at the very, very top of the food chain.

Did you know that 8 men now have as much wealth as the poorest 3.6 billion people living on the planet combined?

Every year, the gap between the planet’s ultra-wealthy and the poor just becomes greater and greater.  This is something that I have written about frequently, and the “financialization” of the global economy is playing a major role in this trend.

The entire global financial system is based on debt, and this debt-based system endlessly funnels the wealth of the world to the very, very top of the pyramid.

It has been said that Albert Einstein once made the following statement

“Compound interest is the eighth wonder of the world. He who understands it, earns it … he who doesn’t … pays it.”

Whether he actually made that statement or not, the reality of the matter is that it is quite true.  By getting all of the rest of us deep into debt, the elite can just sit back and slowly but surely become even wealthier over time.  Meanwhile, as the rest of us work endless hours to “pay our bills”, the truth is that we are spending our best years working to enrich someone else.

Much has been written about the men and women that control the world.  Whether you wish to call them “the elite”, “the establishment” or “the globalists”, the truth is that most of us understand who they are.  And how they control all of us is not some sort of giant conspiracy.  Ultimately, it is actually very simple.  Money is a form of social control, and by getting the rest of us into as much debt as possible they are able to get all of us to work for their economic benefit.

It starts at a very early age.  We greatly encourage our young people to go to college, and we tell them to not even worry about what it will cost.  We assure them that there will be great jobs available for them once they finish school and that they will have no problem paying off the student loans that they will accumulate.

Well, over the past 10 years student loan debt in the United States “has grown 250 percent” and is now sitting at an absolutely staggering grand total of 1.4 trillion dollars.  Millions of our young people are already entering the “real world” financially crippled, and many of them will literally spend decades paying off those debts.

But that is just the beginning.

In order to get around in our society, virtually all of us need at least one vehicle, and auto loans are very easy to get these days.  I remember when auto loans were only made for four or five years at the most, but in 2017 it is quite common to find loans on new vehicles that stretch out for six or seven years.

The total amount of auto loan debt in the United States has now surpassed a trillion dollars, and this very dangerous bubble just continues to grow.

If you want to own a home, that is going to mean even more debt.  In the old days, mortgages were commonly 10 years in length, but now 30 years is the standard.

By the way, do you know where the term “mortgage” originally comes from?

If you go all the way back to the Latin, it actually means “death pledge”.

And now that most mortgages are for 30 years, many will continue making payments until they literally drop dead.

Sadly, most Americans don’t even realize how much they are enriching those that are holding their mortgages.  For example, if you have a 30 year mortgage on a $300,000 home at 3.92 percent, you will end up making total payments of $510,640.

Credit card debt is even more insidious.  Interest rates on credit card debt are often in the high double digits, and some consumers actually end up paying back several times as much as they originally borrowed.

According to the Federal Reserve, total credit card debt in the United States has also now surpassed the trillion dollar mark, and we are about to enter the time of year when Americans use their credit cards the most frequently.

Overall, U.S. consumers are now nearly 13 trillion dollars in debt.

As borrowers, we are servants of the lenders, and most of us don’t even consciously understand what has been done to us.

In Part I, I have focused on individual debt obligations, but tomorrow in Part II I am going to talk about how the elite use government debt to corporately enslave us.  All over the planet, national governments are drowning in debt, and this didn’t happen by accident.  The elite love to get governments into debt because it is a way to systematically transfer tremendous amounts of wealth from our pockets to their pockets.  This year alone, the U.S. government will pay somewhere around half a trillion dollars just in interest on the national debt.  That represents a whole lot of tax dollars that we aren’t getting any benefit from, and those on the receiving end are just becoming wealthier and wealthier.

In Part II we will also talk about how our debt-based system is literally designed to create a government debt spiral.  Once you understand this, the way that you view potential solutions completely changes.  If we ever want to get government debt “under control”, we have got to do away with this current system that was intended to enslave us by those that created it.

We spend so much time on the symptoms, but if we ever want permanent solutions we need to start addressing the root causes of our problems.  Debt is a tool of enslavement, and the fact that humanity is now more than 200 trillion dollars in debt should deeply alarm all of us.

Michael Snyder is a Republican candidate for Congress in Idaho’s First Congressional District, and you can learn how you can get involved in the campaign on his official website. His new book entitled “Living A Life That Really Matters” is available in paperback and for the Kindle on Amazon.com.


Italy’s Parallel Fiscal Currency: All You Need To Know

$
0
0

Authored by Marco Cattaneo, from Basta con l’Eurocrisi, via GEFIRA,

There is an increased talk in Italy about fiscal money as an instrument to resolve the economic crisis, which is not over yet.

Despite the optimism shown by the Italian government and the EU, the Eurozone economy is far from being in an acceptable condition, and this applies in particular for Italy.

In 2017 Italy’s real GDP will grow by 1.5% compared to the previous year, which is 6% less than what it was in 2007, ten years earlier! Within the same period unemployment has doubled, the number of people in poverty tripled from 1.5 million to almost 5, and this trend does not seem to be reversing. The Italian economic system is working far below its potential: this gap has been created first by the global financial crisis of 2008 and then by the austerity policies “prescribed” by the EU in 2011. Italy can solve this problem by introducing an adequate quantity of purchasing power in its economic system. It can’t do it by issuing euros, nor (due to the mechanisms of the Eurozone) by increasing the state deficits.

All these difficulties stem from the fact that Italy is not an issuer but a user of the currency, the euro. The introduction of a fiscal currency might help to bypass the constraint that Rome cannot print money and maintain the impression that the euro works. The fiscal money concept goes back to chartalism theorised by German economist Georg Friedrich Knapp at the beginning of 1900 and then expanded by the economists adhering to the “Modern Monetary Theory” (MMT).

The basic principles of the fiscal money are two:

  1. First: it is a particular government bond that has a value given to it by the state, even if it does not enjoy the status of a legal tender. In other words, the state binds itself to accept it, e.g. for the payment of taxes or governmental services, while business and citizens are free to use it or not. .
  2. Second: as the bond is not designed to be reimbursed with the euro, which the state can no longer emit, the state is always able to honour its agreement. The bond cannot be exchanged for euros, but bondholders can use this special bond to pay their taxes or services provided by the state. It principle looks like a discount coupon that cannot be exchanged for euros but has a value, and oblige the issuer to provide a discount.

Since the state agrees to accept it but not to redeem it, it can’t default on its obligation. Such a bond is equivalent to a sovereign currency.

How can the fiscal money work in Italy?

Right now in Italy, three opposition parties are evaluating the fiscal money proposal.

Forza Italia (Berlusconi’s party), proposes Fiscal Credit Certificates (CCF). CCFs were initially invented by Marco Cattaneo and then developed with the help of various economists and researchers in numerous articles, books and an ebook that gained widespread popularity. The state emits CCFs witch gives the right to a reduction in the payment of taxation (or any other financial transaction with the public sector) two years after their emission.

CCFs are distributed in different ways: To workers to increase their income, as some reverse tax; To businesses to reduce the weight of taxation on income (which implies an immediate increase in competitiveness with foreign businesses. and prevents the economic recovery from deteriorating the trade balance);
To low-income groups as a form of social spending; as an addition to what they already get in euros.

They can also be used to finance public investment.

While the CCFs are not legal tender, they have value because everybody can use them to pay taxes or buy government services. And since they have value, they can be exchanged for goods or euros. Suppose that the Italian government issues CCFs worth 100 euros in tax. It is highly likely that commercial operators, such as shops, will accept CCFs as an alternative for the euro. Commercial operator can use the acquired CCFs to fulfil their tax obligation.

CCFs are officially not government debt and do not add to the total amount of Italian public debt. The Italian government will accept the CCFs two years after issuance, in the meantime they can be used as a parallel currency. Two years between the emission and the use to pay taxes will be enough for the economic recovery in the form of GDP increase, simply because CCFs have increased purchasing power and economic activities, and thus tax revenue increase, compensating for the reduction of state revenue caused by payment via CCFs. During the two years that they are in circulation, the CCFs will function as legal tender, and the Italian government can increase its spending by paying its expenditures partly in CCFs, and without increasing the national debt.

Movimento 5 Stelle (the movement started by comedian Beppe Grillo) has expressed interest in the model proposed by Gennaro Zezza.

It envisages digital fiscal money in the form of electronic cards distributed among the public. Units of value can be used for the purchase of goods and services in the private sector. Unlike the other versions of ”fiscal money”, this one would not require the 2 years delay after the emission. The use to pay taxes will be possible in installments, say 20% per year starting from the beginning.

Lega Nord and in particular Claudio Borghi, responsible for economic policies, propose the emission of “Minibots”, or CCFs that would circulate in the form of paper with the same size as the euro banknotes. Minibots would be issued to businesses or individuals who have the right to a fiscal deduction. Instead of a tax deduction, the company or person receive an equal amount of “Minibots”, Minibots could be used immediately to pay taxes or as a form of payment for services by state enterprises.

Minibots do not increase the receiver’s assets because they cancel out the right of a promised tax deduction or another form of a credit of the state. It transforms, however, an illiquid credit, the government owes a private company or person, into an instrument that can circulate and be used immediately.

Fiscal money: a permanent or provisional solution?

Fiscal money is an instrument manageable by the national government to boost both internal demand and increase the competitiveness of Italian businesses by lowering the taxation. It restores in the euro-system the flexibility necessary to correct its dysfunctions, without necessarily breaking it. The emission time can be organized to ensure

  1. high levels of employment,
  2. an optimum trade balance,
  3. meeting public finance budget constraints.

When it comes to Point (iii) in particular, given a goal of fiscal deficit (the difference between expenditure and revenue of the state), the necessary level to end the negative economic cyclical phase will be obtained via an adequate level of emission of fiscal money.
The parallelism between fiscal money and the euro gives the possibility to create a stable eurozone. In this sense, fiscal money must become an instrument permanently available to governments to enact anti-cyclical policies and overcome moments of difficulty for the economy (starting with the current one). It is possible that the emission of fiscal money will lower to zero during a particularly positive economic cycle. The instrument would always be available in case of need.

Fiscal money and EU legislation

The fiscal money idea is not in conflict with any existing EU legislation. It is not a currency as the law does not force its acceptance. Therefore it does not violate the principle of monetary monopoly of the ECB when it comes to emitting legal tender, the euro. It is not public debt. Eurostat rules clarify without ambiguity that it is not debt as long as the public sector is not forced to make payments in it. Fiscal money is a non-payable tax credit: it does not create a right to be paid but a right to reduce the tax payments due. There is no due date or coupon payment. When the Italian government issues 1 billion euro future tax credits, it does not increase the national debt.

Most importantly, the regulations of the Eurozone are based on the principle of not increasing the risk of default on public debt by member states. Emitting fiscal money does not conflict with this goal because no state can be forced to default on a bond that is a future fiscal discount. The Italian government will never be forced to redeem CCFs or Minibots in the euro, a currency that the Italian state has no sovereignty over and cannot create.

Naturally, the existence of fiscal money can constitute a first step for a state to leave the euro system if at a certain point the fiscal money is declared legal tender instead of the euro. The Emission of fiscal currency comes with a risk: it could be the end of the euro. However, the real risks of the end of the euro result from the design flaws of the Eurozone and are not created by the emission of fiscal money. The Eurozone problems already exist and will continue until the ongoing dysfunctions are fixed, dysfunctions that the fiscal money helps to overcome.

Will America’s Prosperity Be Completely Wiped Out By Our Growing Debt?

$
0
0

The federal government is now 20.4 trillion dollars in debt, and most Americans don’t seem to care that the economic prosperity that we are enjoying today could be completely destroyed by our exploding national debt.  Over the past decade, the national debt has been growing at a rate of more than 100 million dollars an hour, and this is a debt that all of us owe.  When you break it down, each American citizen’s share of the debt is more than $60,000, and so if you have a family of five your share is more than $300,000.  And when you throw in more than 6 trillion dollars of corporate debt and nearly 13 trillion dollars of consumer debt, it is not inaccurate to say that we are facing a crisis of unprecedented magnitude.

Debt cannot grow much faster than GDP indefinitely.  At some point the bubble bursts, and when it does the pain that the middle class is going to experience is going to be off the charts.  Back in 2015, the middle class in the U.S. became a minority of the population for the first time ever.  Never before in our history has the middle class accounted for less than 50 percent of the population, and all over the country formerly middle class families are under a great deal of stress as they attempt to make ends meet.  The following comes from an absolutely outstanding piece that was just put out by Charles Hugh Smith

If you talk to young people struggling to make ends meet and raise children, or read articles about retirees who can’t afford to retire, you can’t help but detect the fading scent of prosperity.

It has steadily been lost to stagnation, under-reported inflation and soaring inequality, a substitution of illusion for reality bolstered by the systemic corruption of authentic measures of prosperity and well-being.

In other words, the American-Dream idea that life should get easier and more prosperous as the natural course of progress is still embedded in our collective memory, even though the collective reality has changed.

The reality that most of us are facing today is a reality where many are working two or three jobs just to make it from month to month.

The reality that most of us are facing today is a reality where debts never seem to get repaid and credit card balances just continue to grow.

The reality that most of us are facing today is a reality where we work day after day just to pay the bills, and yet we never seem to get anywhere financially.

The truth is that most people out there are deeply struggling.  The Washington Post says that the “middle class” encompasses anyone that makes between $35,000 and $122,500 a year, but very few of us are near the top end of that scale

It’s also situation specific. “The more people in a family, the more money they typically need to live a comfortable middle-class lifestyle,” writes the Post. Likewise, the more expensive your area, the more you need to make to qualify. Overall, “America’s middle-class ranges from $35,000 to $122,500 in annual income, according to The Post’s calculation” approved by the Pew Research Center.

“The bottom line is: $100,000 is on the middle-class spectrum, but barely: 75 percent of U.S. households make less than that,” writes the Post.

In a previous article, I noted that the bottom 90 percent of income earners in the U.S. brought home more than 60 percent of the nation’s income back in the early 1970s, but last year that number fell to just 49.7 percent.

The middle class is shrinking year after year, and the really bad news is that it appears that this decline may soon accelerate.  In fact, one major European investment bank is warning that the U.S. economy will “slow down substantially” in 2018.

But we can’t afford any slow down at all.  As it is, there is no possible way that we are going to be able to deal with our exploding debts at the rate the economy is growing right now.  According to Boston University professor Larry Kotlikoff, we are facing a “fiscal gap” of 210 trillion dollars over the next 75 years…

We have all these unofficial debts that are massive compared to the official debt. We’re focused just on the official debt, so we’re trying to balance the wrong books…

If you add up all the promises that have been made for spending obligations, including defense expenditures, and you subtract all the taxes that we expect to collect, the difference is $210 trillion. That’s the fiscal gap. That’s our true indebtedness.

Where in the world is all of that money going to come from?

Are you willing to pay much higher taxes?

Are you willing to see government programs slashed to a degree that we have never seen before in U.S. history?

If your answer to both of those questions is no, then what would you do to solve the fiscal nightmare that we are facing?

According to Brian Maher, author Robert Benchley once sat down to write an article about this fiscal mess, and what he came up with sums up the situation perfectly…

Benchley sat at his typewriter one day to tackle a vexing subject.

He opened his piece with “The”… when the full weight of his burden collapsed upon his shoulders.

He abandoned his typewriter in frustration.

He returned shortly thereafter and resumed the task anew…

With only “The” to work with… Benchley immediately knocked out the article, presented here in its entirety:

“The hell with it.”

Unfortunately, we can’t afford to say that.

Our exploding debt is a crisis that we must tackle, and the first step is to understand that our current financial system was literally designed to create as much debt as possible.  Once we abolish the Federal Reserve, our endless debt spiral will end, but until we do our debt problems are only going to continue to grow until the system completely implodes in upon itself.

Michael Snyder is a Republican candidate for Congress in Idaho’s First Congressional District, and you can learn how you can get involved in the campaign on his official website. His new book entitled “Living A Life That Really Matters” is available in paperback and for the Kindle on Amazon.com.

Emerging Market Junk Debt Issuance Surges To New Record As The “Search For Yield” Intensifies

$
0
0

It seems that the never-ending “thirst for yield” from the world’s massive pension funds, combined with the ever-present “cash on the sidelines” problem, is driving the creation of yet another global financial bubble in emerging market junk bonds.  Alas, as the FT points out today, the world’s largest fixed income investors can’t seem to get enough of the risky paper as bond issuance by the most financially vulnerable countries has suddenly spiked to a all-time high of $75 billion just as spreads are tightening to all-time lows.

Junk-rated emerging market sovereigns have raised $75bn in syndicated bonds so far this year, up 50 per cent year on year to the highest total on record, according to figures from Dealogic, a data provider.


The increase has buoyed the total volume of debt-raising by developing economies; non-investment grade issuance has made up 40 per cent of the new debt syndicated in EM so far in 2017.


These rare and new issuers have been lured into the market by attractive pricing — strong investor demand for EM debt has pushed pricing up and yields down, making it one of the best-performing assets globally in 2017.


According to Bloomberg Barclays indices, EM’s local currency-denominated sovereign debt has returned 10.4 per cent since the start of this year, while dollar-denominated debt has returned 7.6 per cent. By contrast, US Treasuries have returned 2.5 per cent while European nations’ debt has returned 0.9 per cent.

Of course, for all the “doom and gloom” predictions of an imminent crash in Emerging Markets (here and here, among many others), not only have these not materialized, but the average yield on corporate junk bonds issued by emerging markets has dropped to record-low levels of around 5.5%, compared to nearly 10% just 2 years ago.

For a case study of the yield-chasing insanity unleashed by central bankers, one has to look no further than Tajikistan.

The central Asian country last month raised $500 million in its first-ever international bond sale, paying just 7.125% in annual interest on the debt after the U.S.-dollar offering drew a swarm of American and European buyers. Bankers had earlier shopped the 10-year bonds from the former Soviet satellite with an 8% yield, which was pulled down by strong investor demand.

The reason for the scramble into any piece of yielding debt, even Tajik junk bonds is simple: as the IMF shows today in its latest financial stability report, there are virtually no IG bonds left with yields above 4%, and in the junk bonds space, whether in the US or offshore, it isn’t much better.

Meanwhile, as the head of EM asset allocation at UBS Wealth Management, Michael Bollinger, pointed out to the FT, holding the 7.125% Tajik bonds until maturity can be a great yield for a pension fund with a 7% return target…that is, until the bonds can’t be refinanced at maturity.

Michael Bollinger, head of EM asset allocation at UBS Wealth Management, said that relatively high-risk, high-yield sovereigns were attractive to institutional investors and private clients to hold to maturity.


“The problem with liquidity is that when you need it most, it is least available, and that problem can be particularly pronounced in these rare issuer names,” he said.


Will the flurry of issuance continue? Mr Bollinger expects it to ease off. “Some of these guys will start to find it more difficult — at this point in the cycle it is time to become more selective in EM bonds,” he said.


Meanwhile, Mr Rediker warns that sovereigns with poor credit ratings could struggle to refinance their debt when it matures.


“What if the rollover risk is greater than investors and issuers think it is?” he said. “That is a premise that not everybody seems to be taking as seriously as they might.”

Of course, with garbage bonds (it’s a technical term) in Illinois yielding 3.74% (see: Muni Investors Celebrate “Juicy” 3.74% Yield On New Illinois Bonds As State Hurdles Toward Bankruptcy), it’s not all that difficult to understand why bond investors see relative value in Tajikistan.

Stockman: US Entry Into World War I Was A Disaster

$
0
0

Authored by David Stockman via The Daily Reckoning,

103 years ago, in 1914, the Federal Reserve opened-up for business as the carnage in northern France was getting under way.

And it brought to a close the prior magnificent half-century era of liberal internationalism and honest gold-backed money.

The Great War was nothing short of a calamity, especially for the 20 million combatants and civilians who perished for no reason discernible in any fair reading of history, or even unfair one.

Yet the far greater calamity is that Europe’s senseless fratricide of 1914-1918 gave birth to all the great evils of the 20th century – the Great Depression, totalitarian genocides, Keynesian economics, permanent warfare states, rampaging central banks and the follies of America’s global imperialism.

Indeed, in Old Testament fashion, one begat the next and the next and still the next.

The old liberal international economic order – honest money, relatively free trade, rising international capital flows and rapidly growing global economic integration – resulted in a 40-year span between 1870 and 1914 of rising living standards, stable prices, massive capital investment and prolific technological progress that was never equaled either before or since.

The Great War undid it all.

In the case of Great Britain, for example, its national debt increased 14-fold, its price level doubled, its capital stock was depleted, most off-shore investments were liquidated and universal wartime conscription left it with a massive overhang of human and financial liabilities.

Yet England was the least devastated.

In France, the price level inflated by 300% its extensive Russian investments were confiscated by the Bolsheviks and its debts in New York and London catapulted to more than 100% of GDP.

Among the defeated powers, currencies emerged nearly worthless with the German mark at five cents on the pre-war dollar, while wartime debts – especially after the harsh peace of Versailles – soared to crushing, unrepayable heights.

And the Great Depression’s tardy, thoroughly misunderstood and deeply traumatic arrival happened compliments of the United States.

In the first place, America’s wholly unwarranted intervention in April 1917 prolonged the slaughter, doubled the financial due bill and generated a cockamamie peace, giving rise to totalitarianism among the defeated powers and Keynesianism among the victors.

Even conventional historians admit as much.

Had Woodrow Wilson not misled America on a messianic crusade, the Great War would have ended in mutual exhaustion in 1917 and both sides would have gone home battered and bankrupt but no danger to the rest of mankind.

Indeed, absent Wilson’s crusade there would have been no allied victory, no punitive peace, and no war reparations; nor would there have been a Leninist coup in Petrograd or Stalin’s barbaric regime.

Likewise, there would have been no Hitler, no Nazis, no holocaust, no global war against Germany and Japan and no incineration of 200,000 civilians at Hiroshima and Nagasaki.

Nor would there have followed a Cold War with the Soviets or CIA sponsored coups and assassinations in Iran, Guatemala, Indonesia, Brazil and Chile to name a few. Surely there would have been no CIA plot to assassinate Castro, or Russian missiles in Cuba or a crisis that took the world to the brink of annihilation.

There would have been no domino theory and no Vietnam slaughter, either.

Nor would we have had to come to the aid of the mujahedeen and train the future al Qaeda in Afghanistan. Likewise, there would have been no Khomeini-led Islamic counter-revolution, and no U.S. aid to enable Saddam’s gas attacks on Iranian boy soldiers in the 1980s.

Nor would there have been an American invasion of Arabia in 1991 to stop our former ally Saddam Hussein from looting the equally contemptible Emir of Kuwait’s ill-gotten oil plunder – or, alas, the horrific 9/11 blowback a decade later.

Nor would we have been stuck with a $1 trillion Warfare State budget today. But I digress.

Economically, the Great War enabled the already rising American economy to boom and bloat in an entirely artificial and unsustainable manner for the better part of 15 years.

The realities of war finance also transformed the new Federal Reserve into an incipient central banking monster in a manner wholly opposite to the intentions of its great legislative architect – the incomparable Carter Glass of Virginia.

During the Great War America became the granary and arsenal to the European Allies – triggering an eruption of domestic investment and production that transformed the nation into a massive global creditor and powerhouse exporter virtually overnight.

Altogether, in six short years $40 billion of money GDP became $92 billion in 1920 – a sizzling 15% annual rate of gain.

Needless to say, these fantastic figures reflected an inflationary, war-swollen economy – a phenomena that prudent finance men of the age knew was wholly artificial and destined for a thumping post-war depression.

World War I simply gave birth to the modern Fed as we know it.

When Congress created the Federal Reserve on Christmas Eve 1913, just six months before Archduke Ferdinand’s assassination, it had provided no legal authority whatsoever for the Fed to buy government bonds or undertake so-called “open market operations” to finance the public debt.

In part this was due to the fact that there were precious few Federal bonds to buy. The public debt then stood at just $1.5 billion, which is the same figure that had pertained 51 years earlier at the battle of Gettysburg, and amounted to just 4% of GDP.

Thus, in an age of balanced budgets and bipartisan fiscal rectitude, the Fed’s legislative architects had not even considered the possibility of central bank monetization of the public debt, and, in any event, had a totally different mission in mind.

The big point here is that Carter Glass’ “banker’s bank” was an instrument of the market, not an agency of state policy. The so-called economic aggregates of the later Keynesian models — GDP, employment, consumption and investment — were to remain an unmanaged outcome on the free market, reflecting the interaction of millions of producers, consumers, savers, investors, entrepreneurs and even speculators.

But WWI crossed the Rubicon of modern Warfare State finance. During World War I the U.S. public debt rose from $1.5 billion to $27 billion – an eruption that would have been virtually impossible without wartime amendments which allowed the Fed to own or finance U.S. Treasury debt.

These “emergency” amendments – it’s always an emergency in wartime – enabled a fiscal scheme that was ingenious, but turned the Fed’s modus operandi upside down and paved the way for today’s monetary central planning.

Washington learned that it could unplug the free market interest rate in favor of state administered prices for money, and that credit could be massively expanded without the inconvenience of higher savings out of deferred consumption.

Effectively, Washington financed Woodrow Wilson’s crusade with its newly discovered printing press – turning the innocent “banker’s bank” legislated in 1913 into a dangerously potent new arm of the state.

It was this wartime transformation of the Fed into an activist central bank that postponed the normal post-war liquidation – moving the world’s scheduled depression down the road to the 1930s.

The Fed’s role in this startling feat is in plain sight in the history books, but its significance has been obfuscated by Keynesians presuming that the state must continuously manage the business cycle and macro-economy.

The Great Depression thus did not represent the failure of capitalism or some inherent suicidal tendency of the free market to plunge into cyclical depression — absent the constant ministrations of the state through monetary, fiscal, tax and regulatory interventions.

Instead, the Great Depression was a unique historical occurrence — the delayed consequence of the monumental folly of the Great War, abetted by the financial deformations spawned by modern central banking.

The “failure of capitalism” explanation of the Great Depression is exactly what enabled the Warfare State to thrive and dominate the rest of the 20th century because it gave birth to what have become its twin handmaidens — Keynesian economics and monetary central planning.

Together, these two doctrines eroded and eventually destroyed the great policy barrier – that is, the old-time religion of balanced budgets – that had kept America a relatively peaceful Republic until 1914.

If only we could rewind the clock to 1917 and keep Wilson out of WWI, history – and economics – likely would have been a lot different.

We Give Up! Government Spending And Deficits Soar Pretty Much Everywhere

$
0
0


We Give Up! Government Spending And Deficits Soar Pretty Much Everywhere

Posted with permission and written by John Rubino, Dollar Collapse


We Give Up! Government Spending And Deficits Soar Pretty Much Everywhere - John Rubino


A recurring pattern of the past few decades involves governments promising to limit their borrowing, only to discover that hardly anyone cares. So target dates slip, bonds are issued, and the debts keep
rising.


This time around the timing is especially notable, since eight years of global growth ought to be producing tax revenues sufficient to at least moderate the tide of red ink. But apparently not.


In Japan, for instance, government debt is now 250% of GDP, a figure which economists from, say, the 1990s, would have thought impossible.


Over the past decade the country’s leaders have proposed a series of plans for balancing the budget, and actually did manage to shrink debt/GDP slightly in 2016. But now they seem to have given up, and are looking for excuses to keep spending:


Japan plans extra budget of $24-26 billion for fiscal 2017

(Hellenic Shipping News) – Japan’s government is set to compile an extra budget worth around 2.7-2.9 trillion yen ($24-26 billion) for the fiscal year to March 2018, with additional bond issuance of around 1 trillion yen to help fund the spending, government sources told Reuters.
Following October’s big election win, Prime Minister Shinzo Abe’s cabinet has made plans to beef up childcare support, boost productivity at small and medium-sized companies, and strengthen competitiveness of the farm, fishery and forestry industries.

In the UK, a balanced budget has been pushed back from 2025 to 2031:


Britain in the red until 2031: Bid to balance the books pushed back yet again

(Daily Mail) – Philip Hammond’s ambition to get Britain’s finances back into the black receded further last night – as the Treasury watchdog said he would struggle to eliminate the deficit before 2031.

The Chancellor had promised to balance the books by 2025. The target has been pushed back twice already, after George Osborne’s pledge in his 2010 Budget to balance the books ‘within five years’, before he revised the figure to 2020.

In its assessment to accompany the Budget, the Office for Budget Responsibility said it was now ‘unlikely’ that the Chancellor would balance the books by 2025 as he had hoped.

It said the Government was on course to wipe out the deficit in 2030-31, 30 years after the country was last in surplus.

That would be the longest period of consecutive deficits on record – eclipsing the 25-year borrowing binge between 1793 and 1817 that included the Napoleonic Wars.


In the US, “tax reform” – the alteration of the tax code to make it simpler and more fair – has morphed into tax cutting, which is of course a lot easier:


Donald Trump is going to build a big, beautiful deficit and rely on China to help pay for it

(Washinton Post) – Assuming they pass, Republican tax plans are forecast to increase the federal debt by about $1.3 trillion to $1.6 trillion over the coming decade, though scoring and specifics vary. This is the same debt that, campaigning in Ohio, Trump called “a weight around the future of every young person in this country.”

But now that it’s time to pass a tax plan that nonpartisan observers agree will require deficit spending, Republicans are on board with growing the federal debt. Large-scale borrowing will help make up the gap in lower tax revenue while avoiding some painful cuts to government programs.

To cover that shortfall, Trump’s government and its successors will be issuing additional Treasury bonds for decades to come, with Eric Toder, co-director of the Tax Policy Center, posting that one version of the bill would grow the debt as a share of the economy by 10.1 percentage points by 2037. About half of those bonds will end up being
held abroad, according to Joseph Gagnon, senior fellow at the Peterson Institute for International Economics.

Treasury data compiled by the St. Louis Fed shows that foreign central banks, investors and corporations already own $6.17 trillion in Treasury bonds in the second quarter, compared with $5.73 trillion for private domestic investors. More than a third of those international investors are based in two countries: China and Japan.

China, meanwhile, is taking a different path. Instead of financing big government deficits by issuing bonds, Beijing borrows relatively little but encourages its businesses, local governments and “state-owned companies” to borrow like crazy. So its total debt is soaring:


China’s debt grew in September at fastest pace in four years

(Asia Times) – A Reuters analysis of more than 2,000 China-listed firms showed total debt at the end of September jumping by 23% from a year ago, according to a report Sunday.

The increase, which comes amid an ongoing deleveraging campaign, represented the fastest pace of growth since 2013.
The analysis shows the degree to which de-risking and deleveraging efforts have been concentrated within financial sector so far, with real estate and industrial sectors leading the way in debt growth.

According to the report, debt servicing costs have accounted for close to a quarter of state-owned companies’ revenue. That ratio rose to 27% in the second quarter before falling to just below 25% in the third quarter on increased revenue.

To put the above in visual terms, here’s an infographic from Howmuch.com that shows per-capita government debt for the world’s major countries. Note that a Japanese family of five’s share of its government’s debt is close to $450,000 while in the US a similar family owes $300,000. That’s in addition to their mortgages, car loans, credit cards, etc.


Obviously debts of this magnitude can’t and therefore won’t be repaid. Which means the coming decade will be defined by how — and how quickly — we end up defaulting.


Questions or comments about this article? Leave your thoughts HERE.


We Give Up! Government Spending And Deficits Soar Pretty Much Everywhere

Posted with permission and written by John Rubino, Dollar Collapse


Check out these other articles by our contributors:


Stewart Dougherty –  The War on Gold Intensifies: It Betrays the Elitists’ Panic and Augurs Their Coming Defeat (Part 1)

Stewart Dougherty – The War on Gold Intensifies: It Betrays the Elitists’ Panic and Augurs Their Coming Defeat (Part 2)

Steve St. Angelo – THE BLIND CONSPIRACY: The Gold Market Is Heading Towards A Big Fundamental Change

Eric Sprott and Craig Hemke – Eric Sprott Talks Global Demand for Metals, Impact in 2018 (Weekly Wrap-Up, December 1, 2017)

China’s Infrastructure Boom Heading For Rapid Slowdown In 2018

$
0
0

There have been signs since October’s Party Congress that China’s infrastructure boom was about to cool off as the leadership seeks to contain debt levels and focus on the quality not the quantity of growth. Subway building is one sector which has seen some high-profile project cancellations. In mid-November 2017, Caixin reported that China’s top economic planning authority, the National Development and Reform Commission, was “raising the bar for subway proposals” – increasing scrutiny in terms of fiscal conditions, population and GDP. In recent weeks, we’ve seen two large subway projects shelved, one in Hohhot, the capital city of Inner Mongolia (worth 27 billion Yuan) and another in Baotou, another Inner Mongolian city (worth 30 billion Yuan). As Caixin noted.

The cancellation of the Inner Mongolia subway projects is having a ripple effect in other cities. Several city governments, including those of Xianyang in Shaanxi province and Wuhan in Hubei province, said in statements that their subway plan are unlikely to win immediate approval under the central government’s crackdown on financial risks related to borrowing for such projects.

The crackdown on local government debt, a key source of infrastructure financing, will have a knock-on effect on Chinese GDP growth. A difficulty for China’s central planners is that the infrastructure share of Chinese fixed asset investment has been on a rising trend, surpassing 20% during 2017 versus just over 15% in early 2014. While we’ve been expecting China’s infrastructure spend to slow next year, we are surprised by the rate of slowdown estimated by Bloomberg, which surveyed a large number of forecasters.

China’s frenzied construction of roads, bridges and subways is set for a major slowdown, adding a headwind to economic growth in 2018. The nation’s fixed-asset investment in infrastructure will grow 12 percent next year, according to the median estimate in a Bloomberg survey, down from almost 20 percent in the first ten months this year. All 18 economists in the survey anticipated a moderation, adding to reports by Morgan Stanley, Goldman Sachs Group Inc. and UBS Group AG predicting a similar trend.

The cooling construction fever is taking shape as authorities renew a pledge to focus on debt management following the Communist Party Congress in October. In a rare move, China has suspended subway projects in some cities, and scrutiny has also toughened on public-private partnerships — until now a widespread way to fund projects. The easing could even threaten global capital expenditure growth, as China represents one-fifth of the world’s total investment, according to estimates by Oxford Economics.

Infrastructure investment "grew much faster than other investments in the past five years," Larry Hu, chief China economist at Macquarie Securities Ltd. in Hong Kong, wrote in a note. "Policy makers might be able to accept slower growth for infrastructure spending from next year, as the growth in the past five years is unsustainable."

Slowdown or not, the scale of spending on Chinese infrastructure remains vast, about $1.7 trillion during January-October 2017. The pick-up in spending during the last two years followed efforts by the authorities to promote PPP (public-private partnerships) to finance infrastructure projects as one way to limit the growth in local government debt. As is the case with many things related to investment in China, the policy was quickly subject to abuse. In the majority of cases, the “private” partner in PPP projects turned out to be a state-owned firm, which merely added to the state’s debt burden via a different route. Eight local governments have been reprimanded by the finance ministry and the National Audit Office for “disguised borrowing”. We can only imagine the degree of abuse when local governments guaranteed returns on PPP-funded projects. According to Bloomberg.

The Ministry of Finance last month banned local governments from guaranteeing returns for private investors in PPP projects or backing a project’s debt. The national watchdog for state-owned enterprises also published rules to regulate state companies’ participation — a potential blow to a major source of funding.

"A change in central government’s attitude towards PPP does not bode well for infrastructure in 2018," according to Yao Wei, chief China economist at Societe Generale SA in Paris. "A slowdown from the rapid pace this year looks inevitable."

The challenges for Xi Jinping and his top bureaucrats are mounting, as 2018 looks like it will see the convergence of a host of major reforms of which slower infrastructure spending and altering PPP funding arrangements are a small part. Other major ones include cooling the property market, reducing overcapacity in heavy industry, pollution control, continuing the crackdown on corruption, deleveraging and reforming the out-of-control shadow banking sector.

The China bulls will undoubtedly downplay the scale of these challenges, expecting little deceleration in Chinese growth, helped by a near seamless transition from investment to consumer-led growth. We will be amazed very impressed if Xi can pull it off.
 

A Potential Government Shutdown Is Literally Just Hours Away, But Congressional Leaders Insist That Everything Will Be Just Fine

$
0
0

Either the Republicans are going to give Democrats virtually everything that they want, or the federal government will shut down at the end of the day on Friday.  We have been through this process time after time, and in every single instance the Republicans have always folded like a 20 dollar suit.  Unfortunately, it looks like the Democrats are going to win big this time around too.  The spending agreement is essentially an updated Obama budget that fully funds Planned Parenthood, that contains no money for a border wall, and that doesn’t reflect any of President Trump’s other important priorities either.  On Thursday, the House is expected to pass this horrible bill, and the Senate is expected to take up the matter on Friday.  According to Bloomberg, right now this plan would keep the government open through December 22nd…

The House Rules Committee approved a rule setting the bill up for a floor vote Thursday, after which the Senate will have until the end of the day Friday to avoid a partial government shutdown. A formal check of how members would vote on the Dec. 22 deadline came back showing widespread support, said Representative Dennis Ross, a member of the vote-whipping team.

So even if this plan gets through both the House and the Senate, we will be facing another government shutdown deadline in just a few weeks.

And every time one of these deadlines approaches, the Democrats use it as leverage to get what they want.  In addition to getting a spending agreement that is extremely lopsided in their favor, many Democrats want to use this current deadline to pass the DREAM Act before the end of 2017.  In fact, Kirsten Gillibrand, Kamala Harris, Bernie Sanders, Dick Durbin, Elizabeth Warren and Corey Booker have all said that they will not vote in favor of any spending agreement unless it includes the DREAM Act.

Emboldened by their past successes, Democrats are asking for more than ever this time around.  But if we are just going to hand the Democrats whatever they want every time, what is the point of even having elections?  In 2016 we gave the Republicans control of the White House, the Senate and the House of Representatives, and yet the Democrats just keep winning over and over again.  This is deeply infuriating, and grassroots conservatives all over the country are sick and tired of Republicans acting like spineless jellyfish.

Fortunately, we do have a man with a spine in the White House, and it sounds like he has absolutely no intentions of giving in on the DREAM Act.  The following comes from NBC News

“Democrats are really looking at something very dangerous for our country. They are looking at shutting down, they want to have illegal immigrants, in many cases people that we don’t want in our country,” Trump told reporters at the White House. “We don’t want to have that, we want to have a great, beautiful, crime-free country.”

If the Democrats stand firm on their demands, there is a very real possibility that we could have a government shutdown, and federal agencies are already preparing for one.  When the government shuts down, it only affects about 13 percent of the federal government, and we don’t actually need most of that 13 percent anyway.

So even though the mainstream media would be totally freaking out, it definitely would not be the end of the world.

If you don’t remember the last government shutdown, the following is a pretty good summary of what would happen that was published by Newsweek

If the shutdown does occur this weekend, the effects will be felt immediately. All nonessential employees of the federal government will stay home until further notice, and some will stop receiving paychecks. Refunds from the IRS could be delayed, as could the State Department’s passport service. Most air-traffic controllers and Transportation Security Administration security will continue to go to work, but there won’t be as many as them so air-travel will be slower. Members of Congress will have limited staff and won’t be as responsive (well, as responsive as they normally are) to constituents. And after 10 days without a spending bill, federal courts will close.

Obviously it would be a good thing to avoid a government shutdown, but it is exceedingly foolish to give the Democrats whatever they want just to keep things functioning normally.

In case you are wondering, I would definitely vote “no” on the bill that is currently going through the House of Representatives.  I will not vote in favor of a spending bill that explodes the size of the national debt, that funds Planned Parenthood and that contains no money for a border wall.  I am never going to compromise on my most important principles, and any Republican that caves in and gives the Democrats whatever they want just to avoid a government shutdown should be ashamed of themselves.

Sadly, the Democrats have done a very good job of selling their story to the American people, and at this point most Americans are overwhelmingly in favor of a compromise…

Sixty-three percent say members of Congress should avoid a shutdown at all costs. Only 18 percent of voters surveyed say members should allow a temporary government shutdown if it helps them achieve their policy goals. The remaining 19 percent of voters are undecided.

Of course “compromise” means giving in to the Democrats on virtually every single point.  There are many things that the Democrats will never, ever compromise on, and that is why they keep on winning over and over again.

Most Republicans have been compromising for so long that most of them don’t even stand for anything any longer.

It is time to kick out the corrupt professional politicians and replace them with a new generation of leaders that are willing to stand up for us.  We will have a chance to do that in 2018, and we must not squander this opportunity.

Michael Snyder is a Republican candidate for Congress in Idaho’s First Congressional District, and you can learn how you can get involved in the campaign on his official website. His new book entitled “Living A Life That Really Matters” is available in paperback and for the Kindle on Amazon.com.


Sharing Risks To Counter Germany’s Plans Seeing Target2 Collaterilazation With Gold Reserves

$
0
0

Marcello Minenna, a division head at the Italian securities regulator, emailed his plan to "Cure the Eurozone".

Despite being quite soft (there will not be permanent transfers between Member States), the recent proposals of the European Commission to deepen integration in the economic and monetary union could meet the opposition of Germany as soon as it will come out from the impasse on the creation of the new government. Germany could rather pretend a systematic application of burden sharing provisions in the event of a sovereign debt crisis.

Berlin wants private investors to take part in any losses on Govies and calls for an automatic 3-year debt reprofiling and (should it be not enough) for a restructuring to be approved by easy-to-achieve majorities and implemented according to the technical procedures decided by the Euro-bureaucracy. Appropriate Creditor Participation Clauses should govern these mechanisms and also prevent Govies’ conversion in a new national currency in the case of exit from the euro.

What Germany calls burden sharing is not sharing at all, but a method for legalizing a wider risks segregation within individual countries, just it has happened since the Merkel-Sarkozy meeting in Deauville of late 2010. No coincidence that recently primary German newspapers spoke again of the Weidmann’s proposal to impose a mandatory collateralization of any increase of Target 2 deficits of Club Med countries.

Favorite collateral: GOLD RESERVES of national central banks.

Once exhausted eligible collateral, a debtor country would not be more allowed to further increase its Target 2 liability and money held by its residents would be worth less than in other Eurozone countries. In front of the implicit devaluation of their cash holdings, people would accelerate the capital flight already ongoing (http://www.zerohedge.com/news/2017-09-24/ecbs-target2-lies-exposing-real-capital-flight-italy-spain) to be countered with capital controls which would bring to light the shadow currencies now embedded in sovereign spreads and to a SILENT DISSOLUTION OF THE EURO AREA.

German representatives don’t hesitate to make extreme proposals to get hedged against risks of the periphery. In a speech given in late November at the BIS, Mr. Weidmann perfectly summarized the German feeling about periphery: the wrong with Southern Europe countries is their attitude for “overfishing”, namely for excessive spending. And the lingering bond purchases of the ECB are equally wrong as they prevent interest rate levels “to be aligned more strongly again with the risks in government budgets”.

TRANSLATION: GERMANY CLAIMS THAT SOVEREIGN SPREADS ARE TOO LOW. LET’S DO SOMETHING TO LET THEM RAISE AGAIN.

Sounds crazy, doesn’t it? It’s like wishing a remake of the roller coasters we lived in 2011-2012.

Why, then, is periphery so shy, and why doesn’t it recall that the success of the European project requires risk sharing across members? We share the same currency, but absurdly this currency does not have the same price across Eurozone countries. We still have sovereign yield spreads (albeit mitigated by the ECB’s QE – which, however, will not last forever) causing huge distortions at the economic and financial level for both the public and private sectors.

My ESM reform proposal moves from these considerations. Today the Eurozone bailout fund lends money to a distressed country who agrees to return it at maturity. This could be modified by switching to an insurance-based scheme where the ESM becomes the guarantor of the public debts of all countries: risky members – such as Italy, Spain or Portugal – pay (cash) marked-to-market premiums to the ESM capital and, in exchange, share their sovereign risk with safe members – such as Germany or France.

Specific risk sharing clauses could be embedded in the Govies to be refinanced each year providing for the joint liability of all Eurozone members. Within a decade the public debt of the Euro bloc would be fully mutualized and all States would have the same yield curve and, thus, the same cost of money, just as it should be within a common currency area.

Transition from public debts of individual countries to a unique Eurozone risk-shared debt

Indeed, if markets believe that soon public debts would be risk shared, investors will search profits by going long cheap high-yield Govies and short expensive low-yield Govies, speeding up the convergence process. In turn, such a process would allow risky countries to pay lower and lower premiums on Govies, thus gradually zeroing yield spreads across Euro sovereigns.

At most – should initially markets not believe in the strength of this new policy address – risk perception could worsen on outstanding (non-refinanced) Govies as they are not assisted by risk-sharing clauses and potentially subject to the risk of selective default. Even this issue (however temporary as over time all the debt would be risk-shared) should not have problematic impacts: for the governments (mainly indebted to fixed rate) the interest expense on outstanding Govies would not change, while for the investors these securities would become bonds to hold until maturity in order to avert capital losses.

I expect that initially the costs of the ESM’s guarantee would increase over time as a larger portion of debt would enclose risk sharing clauses. But, then the effect of the convergence across yields would start prevail. For instance, in the case of Italy, starting from the 3rd year the savings in interest expenditure would outweigh costs, leading to a significant net benefit (more than €100 billion at a cumulative level).

Clearly, a complete reversal of markets’ expectations is crucial for the success of the proposed reform. And, of course, politics matters … 17 years ago, the full commitment of governments participating in the Euro project pushed investors to bet on the Germanization of yields. Massive convergence trades took place where market participants sold expensive Bunds and bought cheap Italian BTPs getting positive windfalls from convergence. Again, convergence trades immediately came up in middle 2012 as soon as Draghi announced his “whatever it takes”.

Today, there is a widespread consensus that Germany will have to pay (one way or the other). Well. This means that it could be worth also for Germany to reach an agreement. My proposal to share risks on public debts could prove to be less penalizing for core Eurozone countries than free debt mutualization proposals (so-called Eurobonds) discussed in late 2011. At least, under the reformed ESM set-up, Italy and other peripherals would have to pay to share their risks (Eurobonds do NOT provide for these payments) and the net benefit would come from yields convergence and large fiscal multipliers of public investments.

LET’S NOT FOOL OURSELVES!    … Either risks are shared or the Eurozone will disintegrate as it will remain the last viable option for Southern countries (forced by German orthodoxy).

What I propose instead is an agreement that provides for a temporary application of the subsidiarity principles written in the EU treaties…

Germany will have to accept a normalization of its credit standing (PLEASE DON’T TELL ME THAT GERMAN NEGATIVE RATES ARE NORMAL!) to guarantee a future to itself and the other Eurozone countries….What it can reasonably pretend is that – like in a credit derivative – periphery pays the market price of the redistribution of risks produced by risk sharing and gives up the wild card of deflating its debt by leaving the euro area.

The following table shows the expected impact of the proposed reform in terms of variation in the interest expenditure for selected Eurozone countries (net of the cash contributions of risky countries to the ESM capital). Data are in euro billions.

Germany and France would face higher interest payments, while Italy and Spain would get significant benefits. It is consistent with the predictable redistributive impact of financial resources from the center to the periphery because of risk sharing. Namely the opposite direction of the funds flowed to Germany and its neighbors over the last years due to risk segregating measures.

In front of the initial enlargement of their risk exposure, core countries would rely on a more resilient currency bloc and on the strong commitment of the periphery in favor of responsible fiscal conducts. In fact, moral hazard on fiscal matters would be discouraged by market penalties in the form of higher insurance premiums to be paid to the Stability Mechanism and of slowing down – if not even stopping – the convergence of sovereign yields.

The proposed reform would also address some current weakness of the Stability Mechanism. Now the 89% of the ESM subscribed capital is represented by callable shares (€625bn), while paid in capital is well below the maximum firepower (just €80bn against €500bn of maximum amount disbursable to grant financial support to beneficiary members). Conversely, under the new set-up, the Mechanism could rely on the cash contributions paid by risky countries up to a total amount of €80-100bn. It would mean more than doubling the most solid financial backing available to the ESM. At the same time, the new contribution duties would be exclusively borne by risky countries (as they are the effective net protection buyers within the risk sharing agreement), while safe countries – as Germany and France – would be free of any additional charge.

One might argue that Germany would be entitled to receive these contributions, but such argument would not take into account the need of a super partes arbiter, such as the ESM, to give credibility to the risk-sharing commitment. For similar reasons also the emergence voting procedure should be revised according to a more democratic perspective by removing the veto right currently retained by Germany, France and Italy and lowering the majority needed to agree on a support program.

Of course, such revisions would leave northern countries more exposed to the default risk of peripherals, but it should be clarified that the ultimate aim of the reform is to share risks in order to significantly increase the distance to default of all members of the Euro bloc and make the ESM an authentic stability guarantor.

Chart below from the latest OECD Economic Outlook highlights how nowadays the link between long-term yields on Govies and debt-to-GDP ratio is much stronger than prior the crisis when risk sharing was assumed by financial markets …

…supporting the expectation that the shift to true risk-sharing would deliver a generalized reduction of the debt-to-GDP ratios, a consequent improvement of the debt sustainability for any State and yields convergence. Even most indebted countries such as Italy and Portugal would fall below 100% at the end of the 10th year, while the ratio for the aggregated Eurozone would approach the Maastricht threshold of 60%.

Evolution of the Debt-to-GDP ratio for selected Eurozone countries

The last pillar of the ESM reform should focus on boosting public investments within weakest Eurozone economies in order to comply with the principle of shared growth and development stated by EU treaties. To this aim my proposal foresees a synergistic link between the new Stability Mechanism and the Fiscal Compact. The two inter-governmental agreements are already related to each other as access to ESM assistance programs is conditioned upon the participation within the Fiscal Compact. While preserving this feature, the revised set-up could favor investment opportunities by excluding from the structural balance (i.e. the budgetary balance net of cyclical components and one-off items, which is relevant for the Fiscal Compact) a maximum amount of public expenditure devoted to finance profitable projects backed by the ESM.

Indeed, the ESM could use its leverage capability to raise the funds needed to realize investments located in the Eurozone periphery. Currently the Mechanism operates with a unitary leverage to grant its assistance programs to deeply distressed members; but, under the new mandate, the liquidity raised by the ESM could be re-addressed to productive investments in order to provide more fragile countries with stronger antibodies to immunize from new shocks and reposition themselves on a durable path of growth. Economics are plenty of empirical evidence about the high fiscal multipliers of public investments, especially those located in less developed areas.

Leverage also provides a useful reference to objectively quantify the maximum admissible investment expenditure to be excluded from the structural balance: it must correspond to the cash contributions to the ESM capital charged to risky countries as insurance premiums on their risk-shared debt. Indeed, such a cap would proportionate new liquidity raised with leverage instruments to the updated capital basis of the Mechanism, keeping unchanged its overall leverage ratio and riskiness. A similar provision would also make the new set-up more appealing for peripheral countries required to disburse extra payments to the bailout fund, while core countries’ concerns about the risk of wastes and mis-investments could be addressed by assigning the selection and monitoring of projects to a European committee, such as the European Fiscal Board which to date fulfills a purely advisory role.

The proposed reform could prove decisive in reviving the European project and increasing the resilience and competitiveness of the Eurozone on the global chessboard where massive infrastructural investments are a must. We are 19 different countries but we are supposed (and required) to behave as a unique economic and financial area and risk sharing represents the first step to re-align our diversities. So far, by firstly playing a classical vendor financing strategy and by then deleveraging, Germany has increased its productivity and forced peripheral countries to devalue work to survive in the lack of the re-alignments allowed by exchange rate movements. It’s time for Germany and its closest neighbors to recover some of the risk they have exported and stop claiming that fiscal indiscipline of the periphery is the only cause of its diverging pattern w.r.t. the center.

Is Washington Nuts? Increasing Spending AND Cutting Taxes Will EXPLODE The Size Of The National Debt

$
0
0

Our national debt is rapidly approaching 21 trillion dollars, and yet Congress wants to follow up a large tax cut bill with a massive increase in federal spending.  This is absolute madness, and it is going to make our long-term financial problems as a nation far worse.  After passing the tax bill, the appropriate thing to do would have been to cut federal spending.  Yes, that would have not been a positive thing for the economy in the short-term, but we must start addressing our long-term priorities.  If we do not do something about this exploding national debt, it could potentially destroy our republic all by itself.

Earlier today, I was absolutely horrified when I learned of a budget deal in the Senate that would increase federal spending by about 200 billion dollars in each of the next two years…

The Senate’s Republican and Democratic leaders unveiled a sweeping two-year budget agreement on Wednesday that would increase federal spending by hundreds of billions of dollars on domestic and defense programs alike.

That deal would eliminate strict budget caps, set in 2011 to reduce the federal deficit, and would allow Congress to spend about $200 billion more in the current fiscal year and in fiscal year 2019.

Seriously?

Our federal debt is going to hit 21 trillion dollars some time this year, and they want to throw hundreds of billions of dollars more spending on top of what we are already doing?

This alone is why we need true conservatives all over the nation to run for Congress.  Our endless greed is literally destroying the bright future that our children and our grandchildren were supposed to have.

I don’t know if I even have the words to describe how foolish our leaders are being.  If interest rates on government debt were to return to their long-term averages, the game would already be over.  We should be desperately attempting to get our financial house in order, but instead we are spending money as if tomorrow will never come.

But tomorrow always arrives, and a day of reckoning is fast approaching.

Fortunately, there are some members of Congress that seem to understand that we cannot keep spending money that we do not have.  The following comes from USA Today

Rep.  Mark Meadows, R-N.C., who chairs the hard-line House Freedom Caucus, wants to see what comes back from the Senate, said his spokesman Ben Williamson.

“But if the numbers are as high as we’re hearing, Rep. Meadows does not support the budget deal,” Williamson said.

Rep. Mo Brooks, R-Ala., said “this spending bill is a debt junkie’s dream… I’m not only a ‘no.’ I’m a ‘hell no.’”

As a member of Congress, I would always be a resounding “no” vote on these sorts of absurd budget deals.

Whatever happened to all of the strong fiscal conservatives that we sent to Congress during the days of the Tea Party movement?  So many of them seem to have been enveloped by the swamp and are now doing whatever party leadership tells them to do.

Sadly, most Americans don’t even seem to understand that we have been adding more than a trillion dollars a year to the national debt since Barack Obama first entered the White House.  The following is an extended excerpt from one of my previous articles

When Barack Obama entered the White House, the U.S. national debt was just over 10.6 trillion dollars, and when he left the White House 8 years later it was sitting just shy of 20 trillion dollars.

So during those 8 years more than 9 trillion dollars was added to the national debt. But for purposes of this example we will round down to an even 9 trillion dollars.

When you divide 9 trillion dollars by 8, you get an average of 1.125 trillion dollars that was added to the national debt per year during the Obama era.

Dividing that figure by 365, you find that an average of $3,082,191,780 was added to the national debt every single day during the Obama administration.

And since there are 24 hours in a day, that means that an average of $128,424,657 was stolen from our children and our grandchildren every single hour of every single day while Barack Obama was president.

Under President Trump, we should be dramatically reducing federal spending and the size of the federal government.

Yes, this would hurt the economy in the short-term, but if we continue down the road we are currently on it is a recipe for national suicide.

As interest rates rise, it won’t be too long before we are paying more than a trillion dollars a year just in interest on the national debt.  And when America plunges into a debt nightmare, there won’t be anyone in the entire world big enough to bail us out.

America cannot be great again if we are drowning in debt.  What is happening in Washington is utter madness, and it should greatly anger all of us that our irresponsible politicians are systematically destroying the greatest republic that the world has ever seen.

Michael Snyder is a pro-Trump candidate for Congress in Idaho’s First Congressional District, and you can learn how you can get involved in the campaign on his official website. His new book entitled “Living A Life That Really Matters” is available in paperback and for the Kindle on Amazon.com.

Debt Cancer: More Than 80 Percent Of American Adults Owe Somebody Else Money

$
0
0

How long can our debt levels keep growing much, much faster than the overall economy?  We haven’t had a year of 3 percent growth for the U.S. economy since the middle of the Bush administration, but we keep borrowing money as if there is no tomorrow.  Much of the focus has been on the exploding debt of the federal government, and that is definitely something I plan to address once I get to Washington.  But on an individual level, U.S. consumers have been extremely irresponsible as well.  In fact, one new survey has found that more than 80 percent of all American adults are currently in debt

It’s no secret that America is a nation that runs on debt, but it may surprise you to learn that the overwhelming majority of U.S. adults owe money in some way, shape, or form. According to new data from Comet, here’s how many Americans have debt at present:

  • 80.9% of Baby Boomers
  • 79.9% of Gen Xers
  • 81.5% of Millennials

For most of us, it starts very early.  We were told that going into debt to get a college education would not be a problem because we would be able to pay those loans off with the good jobs we would get after graduation.

Unfortunately, those good jobs never really materialized for many of us, and now millions of former college students are absolutely drowning in debt

A study released Friday by the Brookings Institution finds that most borrowers who left school owing at least $50,000 in student loans in 2010 had failed to pay down any of their debt four years later. Instead, their balances had on average risen by 5% as interest accrued on their debt.

As of 2014 there were about 5 million borrowers with such large loan balances, out of 40 million Americans total with student debt. Large-balance borrowers represented 17% of student borrowers leaving college or grad school in 2014, up from 2% of all borrowers in 1990 after adjusting for inflation. Large-balance borrowers now owe 58% of the nation’s $1.4 trillion in outstanding student debt.

In addition to owing more than a trillion dollars on student loans, Americans are also now carrying more than a trillion dollars of auto loan debt and more than a trillion dollars of credit card debt.

Corporations have been incredibly irresponsible as well.  Corporate debt has doubled since the last financial crisis, and corporate bankruptcies have been rising steadily in recent years.  All it would take for the dominoes to really start falling is some sort of a major economic downturn.

Local, state and federal government debt levels are all at record highs as well.  It is now being projected that our national debt will hit 30 trillion dollars by 2028, and those projections are probably too optimistic.

My guess is that we will almost certainly hit the 30 trillion dollar mark far sooner than that.

We can’t keep doing this to ourselves.  Our incessant greed is literally destroying the future, but anyone that tries to warn about the collective insanity that has descended upon our society is mocked and ridiculed.

Let me ask you a question.

Would you willingly choose to give yourself cancer?

Of course not, but that is essentially what we are doing to ourselves as a society.

Debt is economic cancer, and as Lance Roberts has pointed out, if we continue to allow debt levels to grow like this eventually it will kill our entire economy…

Debt is, by its very nature, a cancer on economic growth. As debt levels rise it consumes more capital by diverting it from productive investments into debt service. As debt levels spread through the system it consumes greater amounts of capital until it eventually kills the host.

Debt is addictive, because it does boost our standard of living in the short-term.  It is so easy to keep going back for one more “hit”, but every time we do it just makes our long-term crisis even worse.

Most people out there seem to think that our economic problems have been “solved”, but that is not true at all.

The truth is that our long-term problems just continue to grow with each passing day, and that is one of the reasons why I am so determined to go to Washington.  We are at such a critical juncture right now, and if something is not done the prognosis is extremely negative.

If we stay on this current path, the very best that we can hope for is a “soft landing” and a greatly reduced standard of living for future generations of Americans.  Here is more from Lance Roberts

The processes that fueled the economic growth over the last 30 years are now beginning to run in reverse, and when combined with the demographic shifts in the U.S., the impact could be far more immediate and prolonged than the media, economists, and analysts are currently expecting. Sacrifices will have to be made, the economy will drag on at subpar rates of growth, individuals will be working far longer into their retirement years and the next generation of Americans will lead a far different life than what the currently retiring generation enjoyed.

It is simply a function of the math.

I am sorry for not writing more lately.  I have been working night and day to get ready for May 15th.  With Donald Trump in the White House, this is our opportunity to take our government back.  If we miss this window, we may never have this sort of opportunity ever again.

America is drowning in debt, but of course our problems go far beyond that.  Our economic, political, cultural and spiritual problems go very deep, and we desperately need to change course as a nation.

Unfortunately, most of the population is in a deep state of sleep, and my hope is that we can wake them up while there is still time to turn things around.

Michael Snyder is a pro-Trump candidate for Congress in Idaho’s First Congressional District, and you can learn how you can get involved in the campaign on his official website. His new book entitled “Living A Life That Really Matters” is available in paperback and for the Kindle on Amazon.com.

The Budget-Busting $1.3 Trillion Spending Bill That Was Just Passed By Congress Is A Betrayal Of The American People

$
0
0

I don’t know if I even have the words to express how disgusted I am with the omnibus spending bill that was just rushed through Congress.  Members of the House of Representatives were given less than 24 hours to read this 2,232 page monstrosity of a bill before they were expected to vote on it, and so obviously nobody was able to read the entire thing before the vote was held.  This is the kind of thing that Democrats were greatly criticized for in the past, but now it is Republicans that are doing it.  The Republican Party is supposed to stand for limited government, and this is yet another example that shows how badly broken the system in Washington has become.

I am running for Congress in Idaho’s first congressional district, and I want to make it exceedingly clear that I would have voted against this bill.  In addition to fully funding Planned Parenthood, this bill also funds a whole host of other liberal priorities.  But other than an increase in military spending, conservative priorities are almost entirely ignored by this bill.

Over the past decade, we have been adding more than a trillion dollars a year to the national debt, and this omnibus spending bill dramatically increases government spending at a time when we should be desperately trying to get our financial house in order.

On Twitter, Rand Paul documented just a few of the examples of the tremendous waste in this bill…

o $12m for Scholarships for Lebanon
o $20m for Middle East Partnership Initiative Scholarship Program
o $12m in military funding for Vietnam
o $3.5m in nutrition assistance to Laos
o $15m in Developmental assistance to China
o $10m for Women LEOs in Afghanistan
o $1m for the World Meteorological Organization
o $218m for Promoting Democracy Development in Europe
o $10m for disadvantaged Egyptian Students
o $1.371bn for Contributions to International Organizations
o $51m to promote International Family Planning and Reproductive Health
o $7m promoting International Conservation
o $10m for UN Environmental Programs
o $5m for Vietnam Education Foundation Grants
o $2.579m for Commission on Security and Co-operation in Europe
o $15m to USAID for promoting international higher education between universities
o $1m for the Cultural Antiquities Task Force
o $6.25m for the Ambassadors Fund for Cultural Preservation
o $20m for Countering Foreign State Propaganda
o $12m for Countering State Disinformation and Pressure

After it passed, Democratic leaders were jubilant.  The following comes from the American Mirror

House Minority Leader Nancy Pelosi and her esteemed counterpart in the Senate, Sen. Chuck Schumer, are declaring the spending bill rushed through by Republicans this week as “a victory.”

“The distinguished leader has clearly put forth many of the priorities that we’re very proud of in a bill that’s one yard high,” Pelosi said of House Speaker Paul Ryan at a joint press conference with Schumer on Thursday.

Senator Schumer also admitted that the Democrats got more accomplished in this bill than they did during any of the spending bills when Barack Obama was in the White House, and Nancy Pelosi added that Republican leadership rushed this legislation through so quickly because “they didn’t want their colleagues to see what was in the bill.”

What we have in Washington D.C. today doesn’t look anything like what our founders originally intended.  It is time to take our government back, and we need fresh leadership in Washington.

I am not going to Washington to be a cog in the system.  Rather, I am going to Washington to drain the swamp and to turn the current corrupt system completely upside down.  If you would like to learn more about what we are trying to do, please visit MichaelSnyderForCongress.com.

Michael Snyder is a pro-Trump candidate for Congress in Idaho’s First Congressional District.  If you would like to help him win on May 15th, you can donate online, by Paypal or by sending a check made out to “Michael Snyder for Congress” to P.O. Box 1136 – Bonners Ferry, ID 83805.  To learn more, please visit MichaelSnyderForCongress.com.

Why America Is Heading Straight Toward The Worst Debt Crisis In History

$
0
0


Today, America is nearly 70 trillion dollars in debt, and that debt is shooting higher at an exponential rate.  Usually most of the focus in on the national debt, which is now 21 trillion dollars and rising, but when you total all forms of debt in our society together it comes to a grand total just short of 70 trillion dollars.  Many people seem to believe that the debt imbalances that existed prior to the great financial crisis of 2008 have been solved, but that is not the case at all.  We are living in the terminal phase of the greatest debt bubble in history, and with each passing day that mountain of debt just keeps on getting bigger and bigger.  It simply is not mathematically possible for debt to keep on growing at a pace that is many times greater than GDP growth, and at some point this absurd bubble will come to an abrupt end.  So those that are forecasting many years of prosperity to come are simply being delusional.  Our current standard of living is very heavily fueled by debt, and at some point we are going to hit a wall.

Let’s talk about consumer debt first.  Excluding mortgage debt, consumer debt is projected to hit the 4 trillion dollar mark by the end of the year

Americans are in a borrowing mood, and their total tab for consumer debt could reach a record $4 trillion by the end of 2018.

That’s according to LendingTree, a loan comparison website, which analyzed data from the Federal Reserve on nonmortgage debts including credit cards, and auto, personal and student loans.

Americans owe more than 26 percent of their annual income to this debt. That’s up from 22 percent in 2010. It’s also higher than debt levels during the mid-2000s when credit availability soared.

We have never seen this level of consumer debt before in all of U.S. history.  Just a few days ago I wrote about how tens of millions of Americans are living on the edge financially, and this is yet more evidence to back up that claim.

Right now, Americans owe more than a trillion dollars on auto loans, and we are clearly in the greatest auto loan debt bubble that we have ever seen.

Americans also owe more than a trillion dollars on their credit cards, and credit card delinquency rates are rising.  In fact, in some ways what we witnessed during the first quarter of 2018 was quite reminiscent of the peak of the last financial crisis

In the first quarter, the delinquency rate on credit-card loan balances at commercial banks other than the largest 100 – so at the 4,788 smaller banks in the US – spiked in to 5.9%. This exceeds the peak during the Financial Crisis. The credit-card charge-off rate at these banks spiked to 8%. This is approaching the peak during the Financial Crisis.

The student loan debt bubble has also surpassed a trillion dollars, and the average young adult with student loan debt has a negative net worth

Despite economic and stock market gains over the past nine years, many young adults are still struggling to get ahead in their financial lives and, in some ways, things may have actually gotten worse.

Americans age 25 to 34 with college degrees and student debt have a median net wealth of negative $1,900, according to a report analyzing 2016 Federal Reserve data released Thursday by Young Invincibles, a young adult advocacy group. That’s a drop of $9,000 from 2013, YI’s analysis found.

Meanwhile, corporate debt has doubled since the last financial crisis.  Thousands of companies are so highly leveraged that even a slight economic downturn could completely wipe them out.

State and local government debt levels are also at record highs, but nobody seems to care.  And if we never have another recession everything might work out okay.

The biggest offender of all, of course, is the United States federal government.  We have been adding about a trillion dollars a year to the national debt since Barack Obama first entered the White House, and Goldman Sachs is projecting that number will surpass 2 trillion dollars by 2028

The fiscal outlook for the United States “is not good,” according to Goldman Sachs, and could pose a threat to the country’s economic security during the next recession.

According to forecasts from the bank’s chief economist, the federal deficit will increase from $825 billion (or 4.1 percent of gross domestic product) to $1.25 trillion (5.5 percent of GDP) by 2021. And by 2028, the bank expects the number to balloon to $2.05 trillion (7 percent of GDP).

Our national debt has been growing at an exponential rate for decades, and because total disaster has not struck yet many people seem to believe that we can keep on doing this.

But the truth is that it simply is not possible.  There is only so much debt that a society can take on before the entire system implodes.

So how close are we to that point?

The following chart comes from Charles Hugh Smith, and it shows the exponential rise in overall debt levels that has taken us to the brink of nearly 70 trillion dollars in debt…

And this next chart from the SRSrocco Report shows how our rate of overall debt growth has compared to our rate of GDP growth…

We are literally on a path to national suicide.

Whether it happens next month, next year or five years from now, it is inevitable that we are going to slam into a brick wall of financial reality.

For the moment, the only way that we can continue to enjoy our current debt-fueled standard of living is to continue increasing our debt bubble at an exponential rate.

But that can only go on for so long, and when the party ends we are going to experience the greatest debt crisis in history.

Today, the average American household is nearly $140,000 in debt, and that is more than double median household income.  And if we were to include each household’s share of corporate debt, local government debt, state government debt and federal government debt, that number would be many times higher.

All of this debt will never be repaid.  Ultimately there will come a day when the system will completely collapse under the weight of so much debt, and most Americans are completely unaware that such a day of reckoning is rapidly approaching.

Michael Snyder is a nationally syndicated writer, media personality and political activist.  He is the author of four books including The Beginning Of The End and Living A Life That Really Matters.


The post Why America Is Heading Straight Toward The Worst Debt Crisis In History appeared first on The Economic Collapse.

Viewing all 150 articles
Browse latest View live


Latest Images